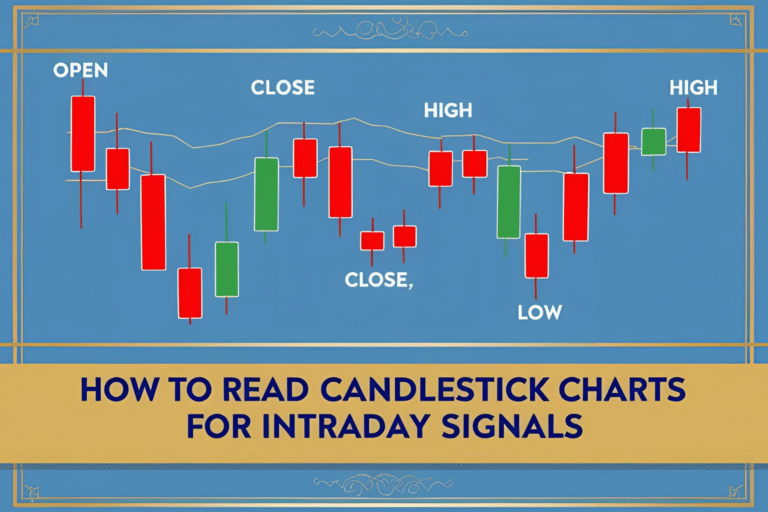
Top 10 Candlestick Patterns for Intraday Trading
Candlestick patterns are a powerful part of intraday trading strategies. They reveal price psychology and signal key market turning points. If you’re looking for quick setups and precise entries, mastering these candlestick patterns can boost your success rate.
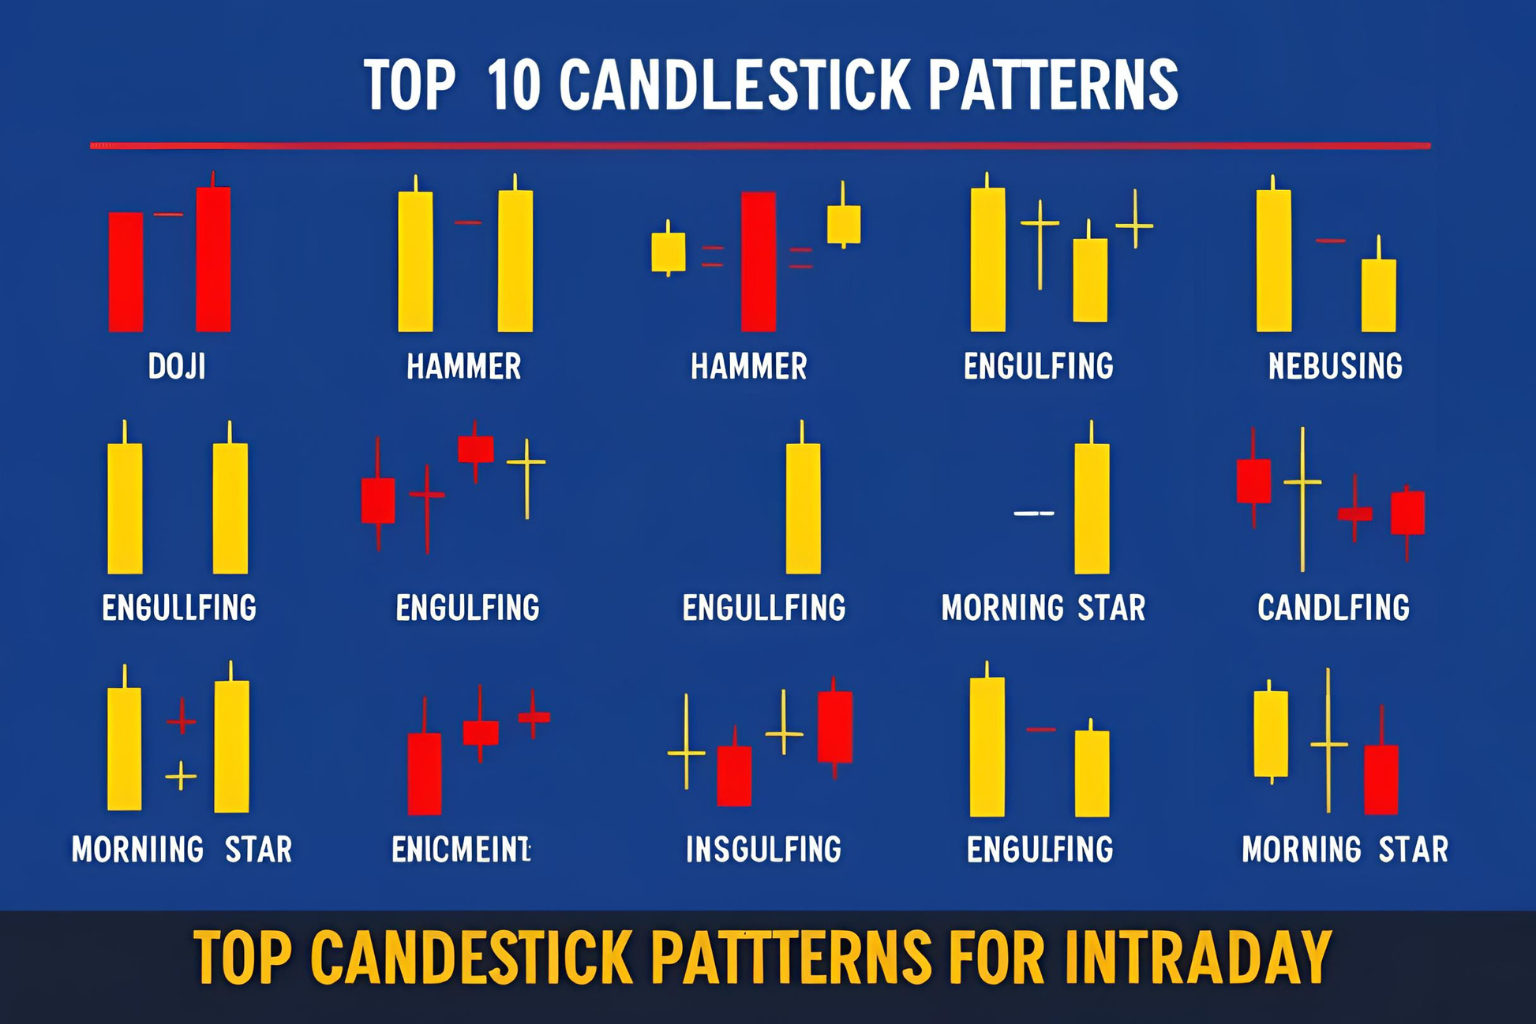
Here are the top 10 candlestick patterns that every intraday trader should know.
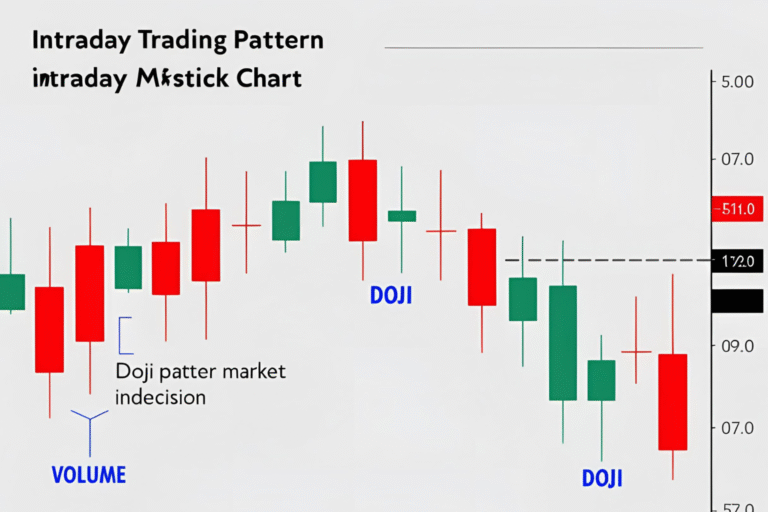
1. Doji
A candle with nearly equal open and close, showing indecision.
Best Use: Watch for reversal when a Doji appears at key support or resistance.
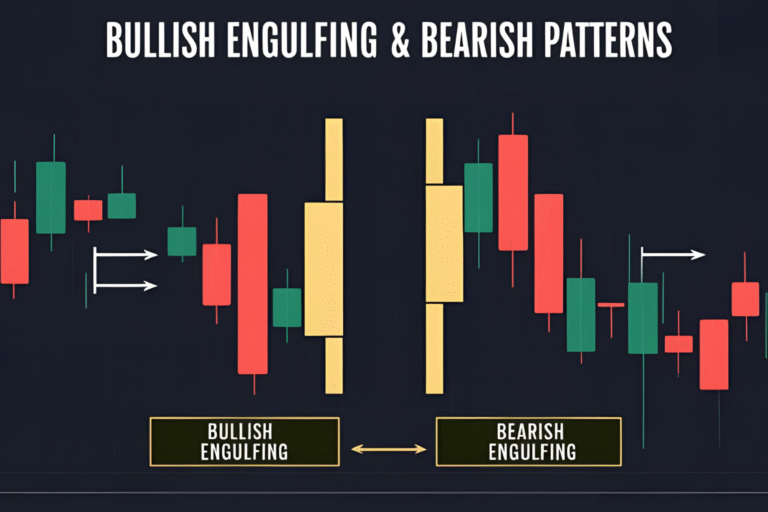
2. Bullish Engulfing
A small red candle followed by a large green one that engulfs it.
Signal: Reversal to the upside, especially after a downtrend.
3. Bearish Engulfing
A small green candle followed by a large red one.
Signal: Indicates a bearish reversal after an uptrend.
4. Hammer
A small body with a long lower wick.
Signal: Bullish reversal after a price decline.
5. Shooting Star
A small body with a long upper wick.
Signal: Bearish reversal after a price rally.
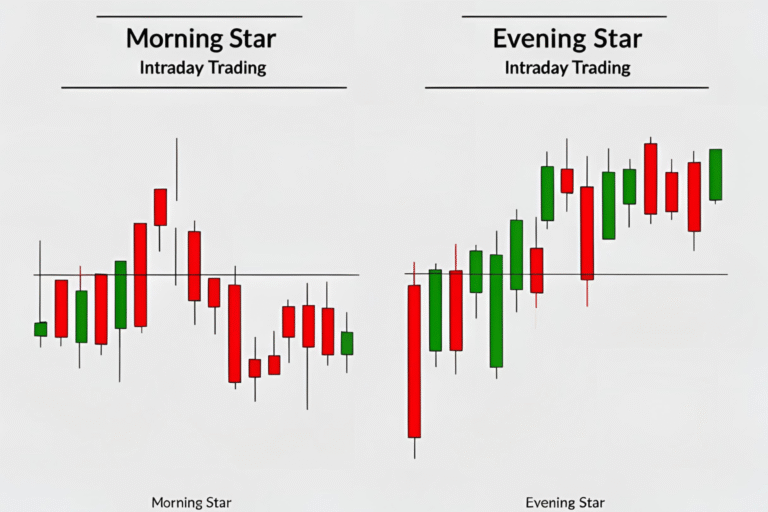
6. Morning Star
Three candles: a red candle, followed by a small-bodied candle, then a large green candle.
Signal: Strong bullish reversal.
7. Evening Star
A large green candle, a small-bodied candle, and a large red candle.
Signal: Signals a bearish reversal.
8. Inverted Hammer
Looks like a shooting star but appears after a downtrend.
Signal: Potential bullish reversal.
9. Hanging Man
Same structure as a hammer but appears after an uptrend.
Signal: Bearish reversal warning.
10. Inside Bar
A small candle within the range of the previous candle.
Signal: Consolidation. Breakout direction defines the move.
How to Use These Patterns in Intraday Trading
- Timeframe: Most traders use 5-minute or 15-minute charts.
- Confirmation: Use volume or indicators like RSI for confirmation.
- Entry: Enter at the close of the confirmation candle.
- Stop-Loss: Just below/above the candle wick.
- Exit: Set realistic targets using support/resistance or risk-reward ratios.
Final Thoughts
Candlestick patterns are not just visual cues—they reflect market sentiment in real time. Combine them with market context, volume, and proper risk control to enhance your intraday trading performance.
FAQs
Do candlestick patterns work well in intraday trading?
Yes, especially when combined with volume and support/resistance levels.
Which candlestick pattern is most accurate?
Engulfing patterns and morning/evening stars are considered highly reliable.
Can beginners use candlestick patterns?
Absolutely. They’re easy to learn and apply, even for new traders.
How many candlesticks should I wait for before confirming a trade?
Usually one confirmation candle is enough, but wait for volume support.
Are candlestick patterns better than indicators?
They serve different purposes. Use both for the best results.