How to Read Candlestick Charts for Intraday Signals
Candlestick charts are the heartbeat of price action in intraday trading. They provide real-time insight into market psychology and help traders spot opportunities with precision. In this guide, we’ll break down how to read candlestick charts for intraday signals—step by step.
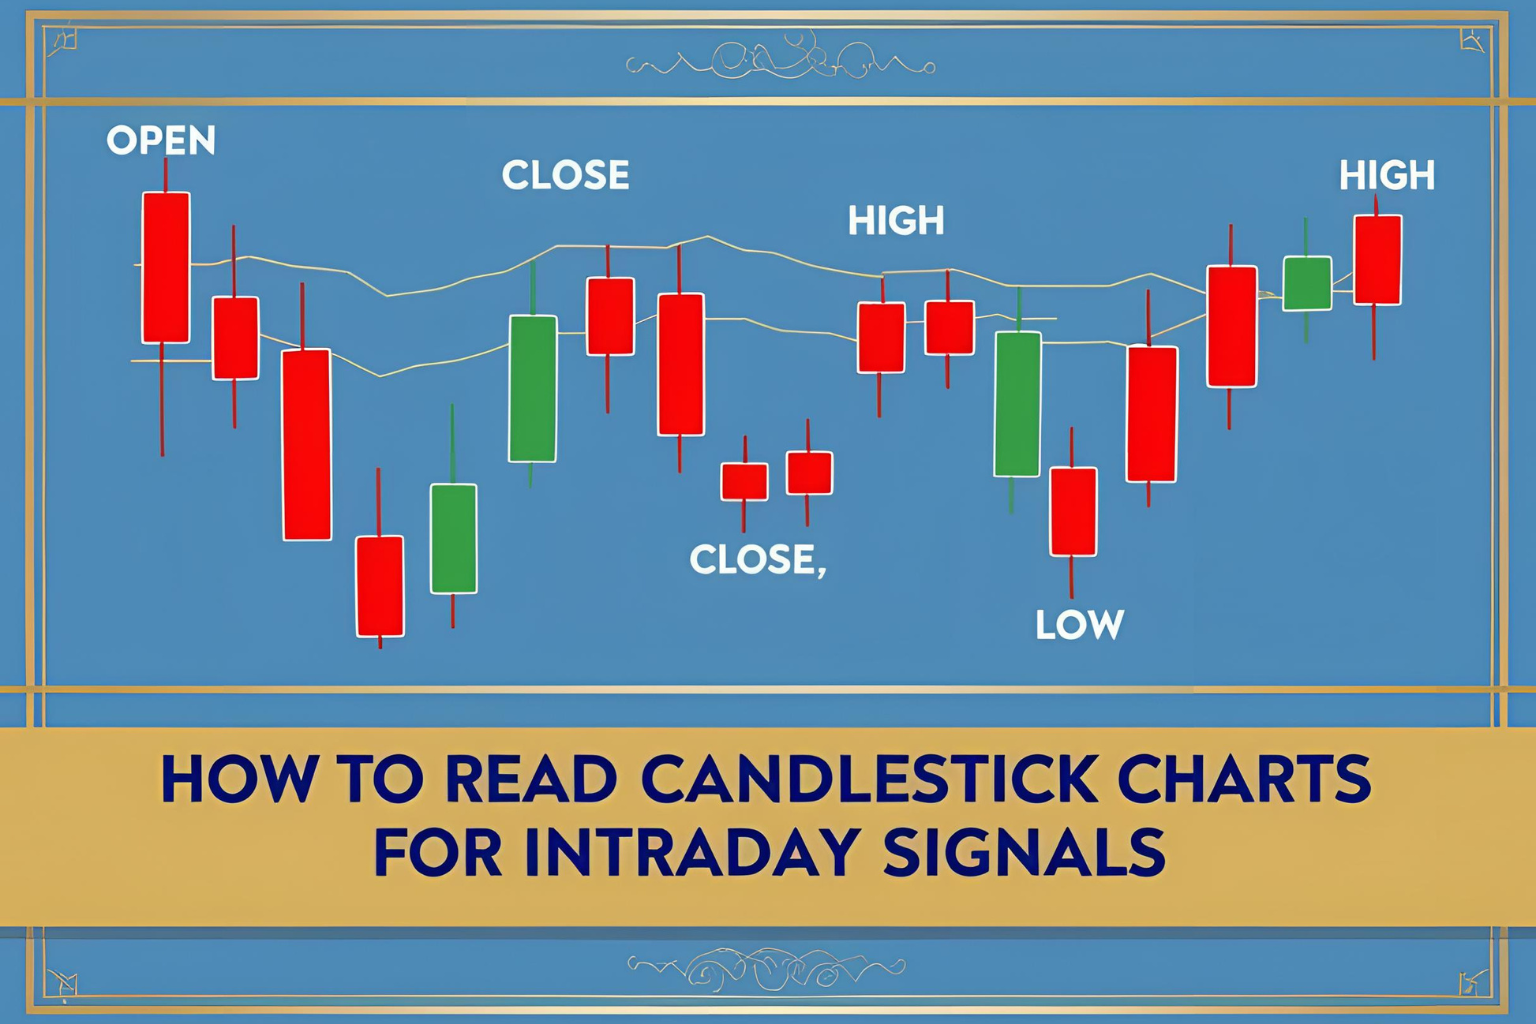
Understanding the Candlestick Structure
Each candlestick represents price movement during a specific time period (e.g., 1-min, 5-min, 15-min). A candlestick consists of:
- Body: Difference between open and close prices.
- Wicks/Shadows: High and low prices during the period.
- Color: Green for bullish (close > open), red for bearish (close < open).
Basic Candlestick Types to Know
1. Bullish Candle
Indicates buying pressure. Typically appears green.
2. Bearish Candle
Indicates selling pressure. Typically appears red.
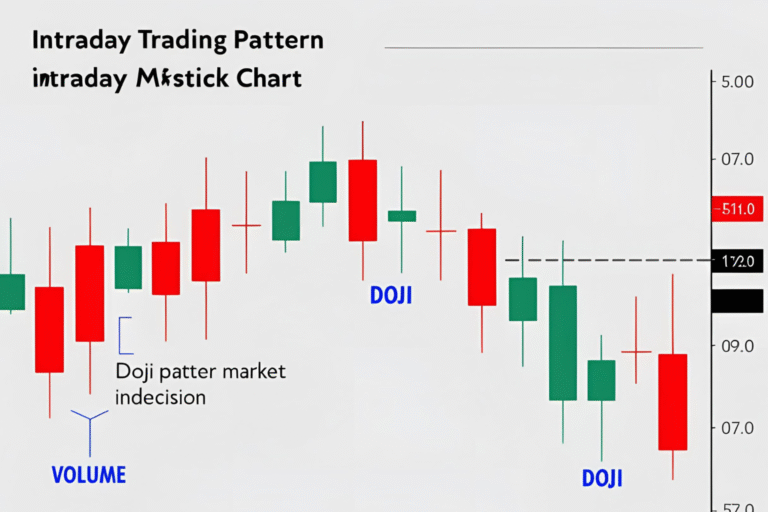
3. Doji
Open and close are nearly the same. Indicates indecision.
4. Long-Wick Candles
Suggest rejection of price in one direction.
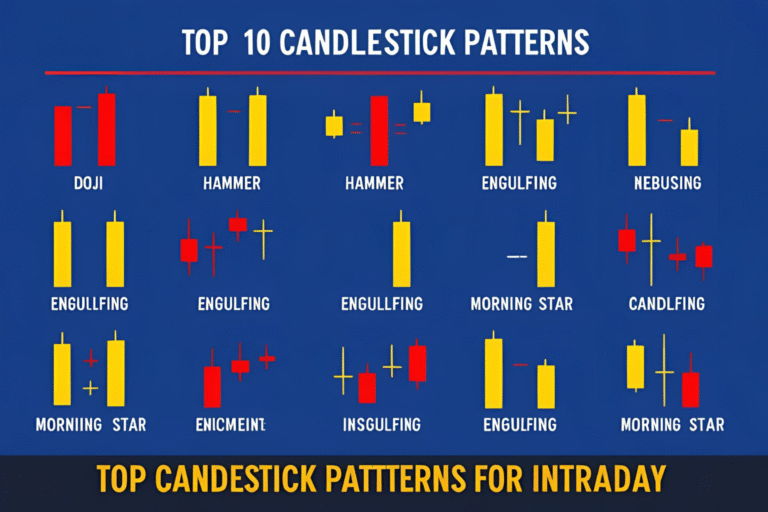
Key Candlestick Signals for Intraday Traders
Bullish Signals
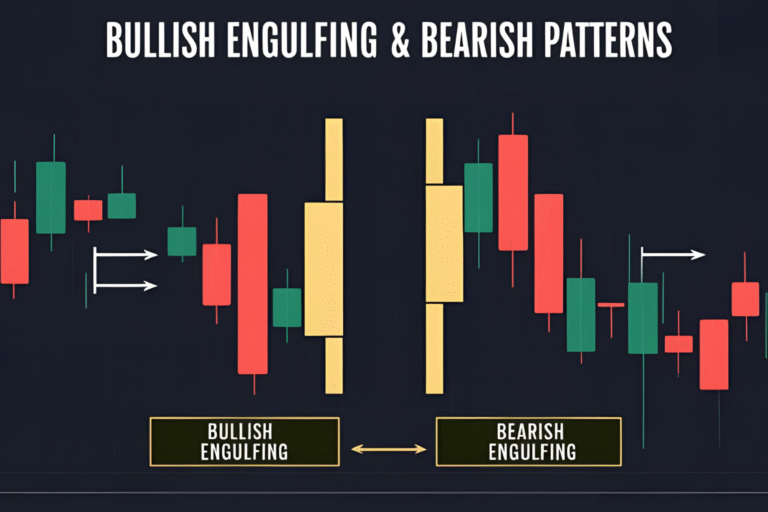
- Bullish Engulfing
- Hammer
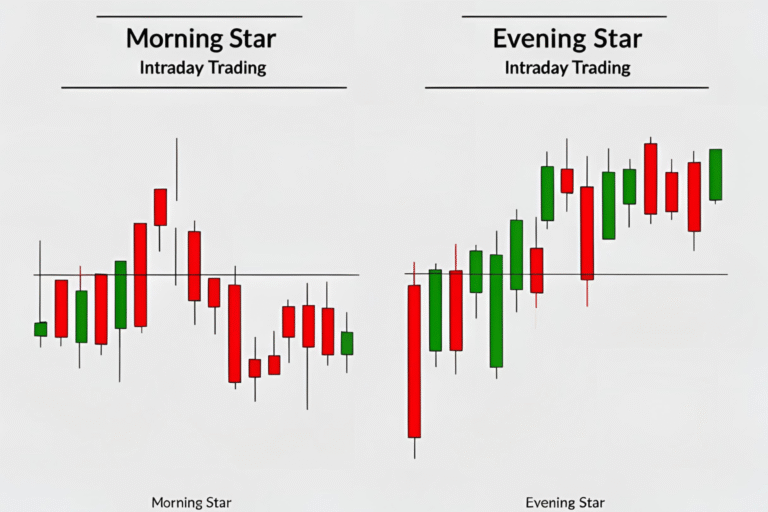
- Morning Star
- Inverted Hammer
Bearish Signals
- Bearish Engulfing
- Shooting Star
- Hanging Man
- Evening Star
Candlestick Combinations That Matter
- Engulfing Patterns: Signal strong reversals.
- Star Patterns: Indicate potential turning points.
- Inside Bars: Show short-term consolidation before breakout.
Timeframes to Use for Intraday Candlestick Reading
- 1-Minute Chart: High-frequency, fast signals
- 5-Minute Chart: Most popular for short-term trades
- 15-Minute Chart: Useful for confirming higher setups
Tips for Reading Candlestick Charts Effectively
- Always read in context: Use support and resistance levels.
- Watch volume: High volume with reversal candle = strong signal.
- Wait for confirmation: Don’t act on a single candle alone.
- Combine with indicators: EMA, VWAP, or RSI can confirm signals.
Example Setup
Pattern: Bullish Engulfing
Chart: 5-Min
Signal: After a series of red candles, a large green candle engulfs the previous one.
Action: Buy above the engulfing candle’s high. Stop-loss below the low.
Final Thoughts
Candlestick reading is an essential skill for intraday traders. It’s fast, visual, and powerful—if used correctly. Don’t just memorize patterns; understand what they represent. With practice, you’ll learn to read the market like a story told candle by candle.
FAQs
Why are candlestick charts popular in intraday trading?
They provide detailed, real-time insights into market behavior within short timeframes.
Which is the best chart to read candlesticks for intraday?
The 5-minute chart is most balanced for pattern recognition and trading decisions.
How do I avoid false candlestick signals?
Always confirm with volume and additional tools like VWAP or trendlines.
Can I use candlestick charts without indicators?
Yes, but combining both often gives more accurate signals.
How long does it take to master candlestick reading?
With daily chart review, most traders build confidence within 2–4 weeks.