Using Doji Candlestick in Intraday Strategy
The Doji candlestick is one of the most important signals in technical analysis. In intraday trading, it often marks a pause in momentum, a potential reversal, or an early sign of consolidation. In this post, we’ll break down how to spot Doji patterns and use them as part of a smart intraday trading strategy.
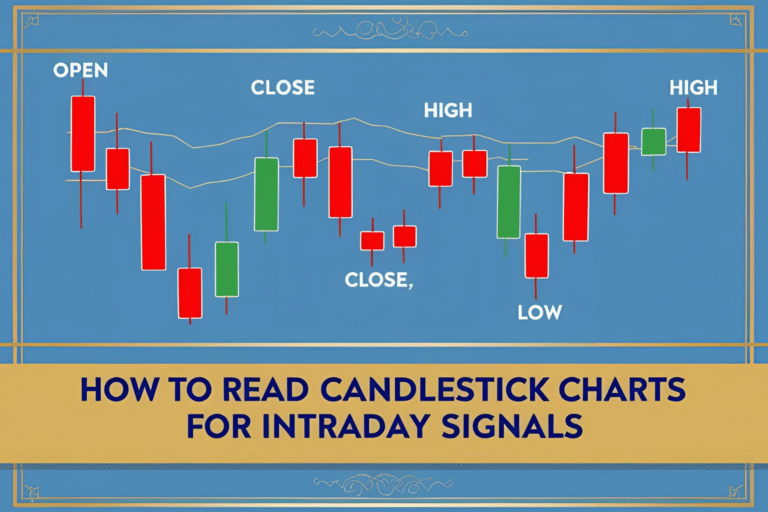
What Is a Doji Candlestick?
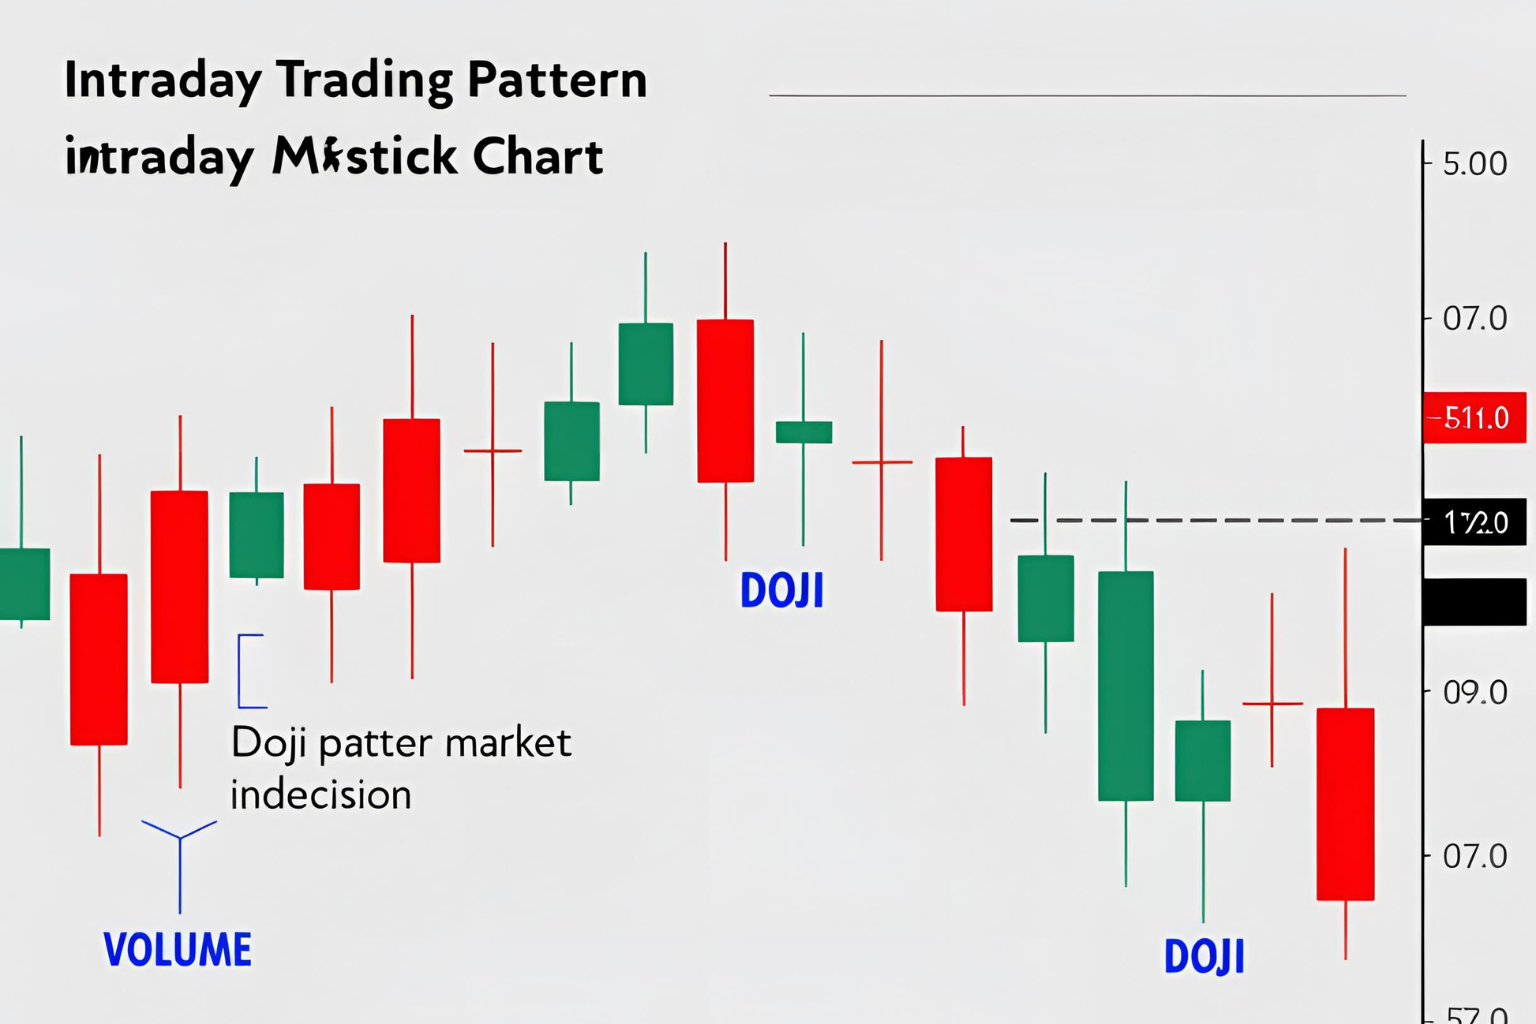
A Doji forms when the open and close prices are nearly equal, creating a candle with a very small body and long upper/lower wicks.
It signals:
- Indecision in the market
- A balance between buyers and sellers
- A potential turning point when it appears at key levels
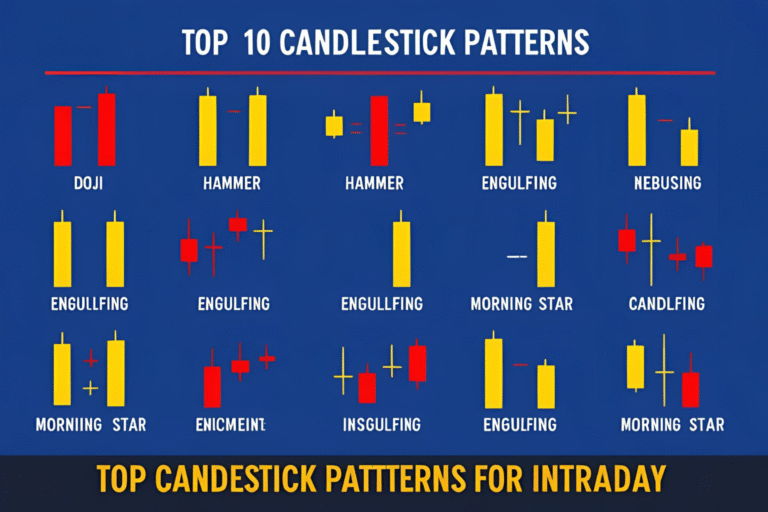
Types of Doji Candles
- Standard Doji: Small body, equal upper and lower wicks.
- Long-Legged Doji: Very long wicks on both sides.
- Gravestone Doji: Open and close at the low of the candle.
- Dragonfly Doji: Open and close at the high of the candle.
How to Trade Doji Candles in Intraday
1. At Support or Resistance Zones
- A Doji at key levels may signal a reversal.
- Confirm with volume or the next candle’s direction.
2. In a Strong Trend
- A Doji in an uptrend may indicate slowing momentum.
- Prepare for a possible pullback or reversal setup.
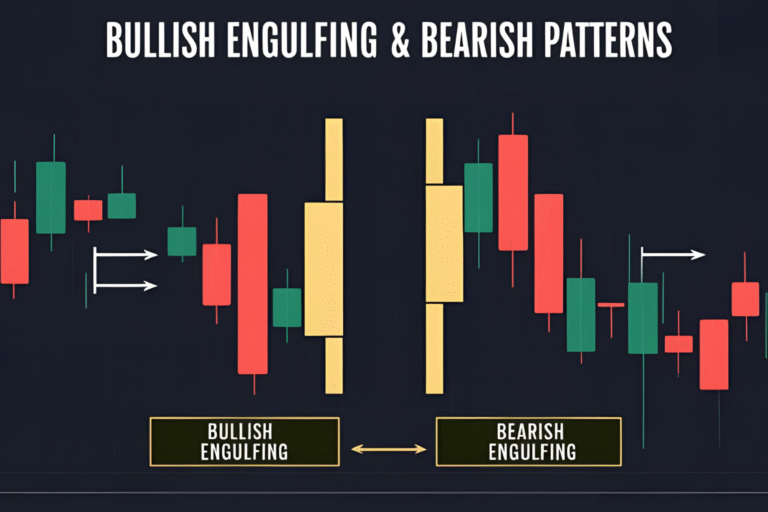
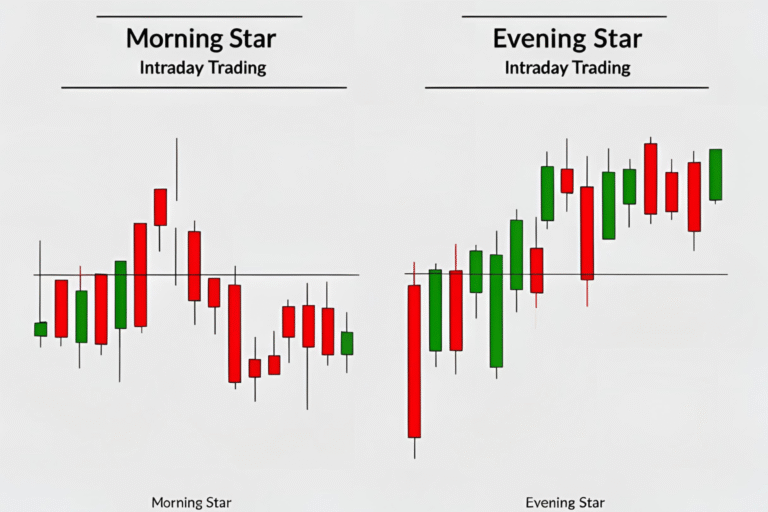
3. With Other Patterns
- Combine with engulfing or star patterns for high-confidence entries.
Entry and Exit Strategy
- Entry: Wait for the next candle after the Doji to confirm direction.
- Stop-Loss: Place just beyond the high/low of the Doji.
- Exit: Use 1:2 risk-reward or nearest key level.
When to Avoid Trading a Doji
- In sideways markets where Dojis occur frequently.
- During news events with high volatility.
- When there’s no trend or context to support a reversal.
Chart Example
Scenario: A Dragonfly Doji appears on the 5-minute chart near intraday support with increasing volume.
Action: Enter long on the next bullish candle. Set stop-loss below the Doji’s low.
Final Thoughts
The Doji candlestick is a subtle yet powerful signal for intraday traders. Used in the right context—near support/resistance or as part of a pattern—it can signal precise entry and exit points. Remember, confirmation is key. Never trade a Doji in isolation.
FAQs
What does a Doji mean in intraday trading?
It shows indecision and is often a sign that the current trend may pause or reverse.
Which timeframe is best for spotting Dojis?
5-minute and 15-minute charts are ideal for intraday use.
Are all Doji patterns reliable?
No. Only trade Dojis with context—support/resistance, trend, or volume confirmation.
Should I wait for the next candle after a Doji?
Yes, the next candle confirms whether buyers or sellers take control.
Do Doji candles appear often in intraday charts?
Yes, but not all are trade-worthy. Focus on those with clean structure and setup alignment.