How to Combine Chart Patterns with Volume Analysis in Intraday Trading
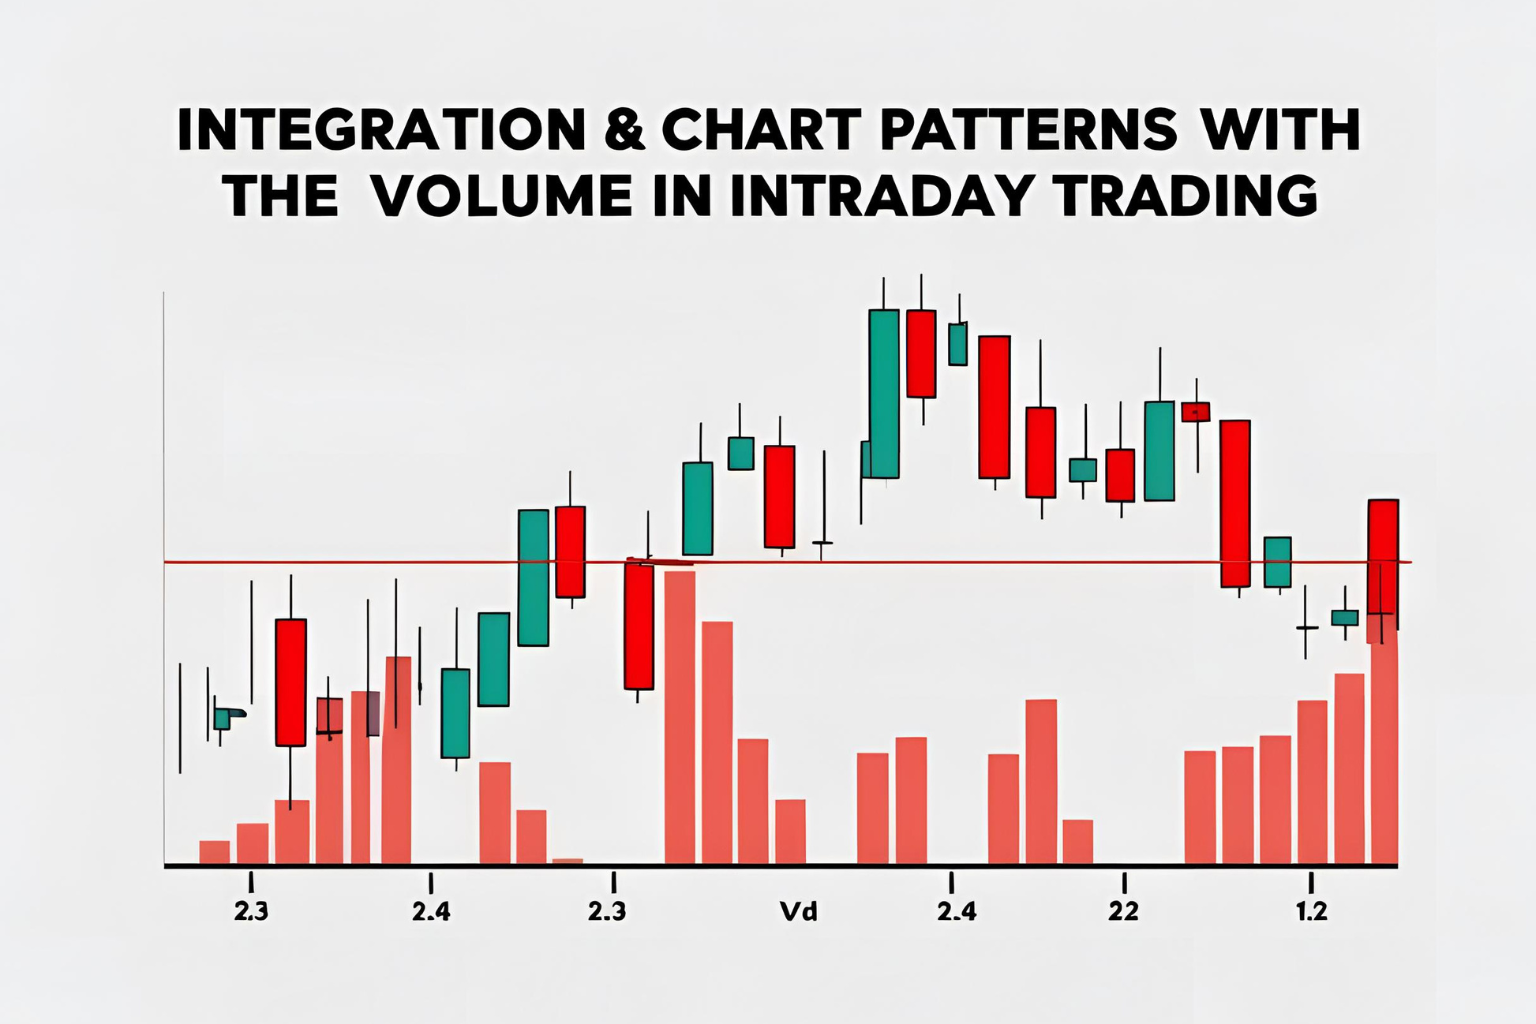
Chart patterns tell the story of price movement, but volume reveals the strength behind the move. In intraday trading, combining chart patterns with volume analysis helps traders validate setups and avoid false signals. This guide shows how to integrate volume with popular patterns for smarter trading.
Why Volume Matters in Intraday Trading
Volume reflects the number of trades executed in a specific time frame. It shows trader interest and participation.
High volume = strong conviction
Low volume = weak or uncertain move
Using volume with patterns helps confirm the validity of breakouts, reversals, and trend continuations.
How to Read Volume with Chart Patterns
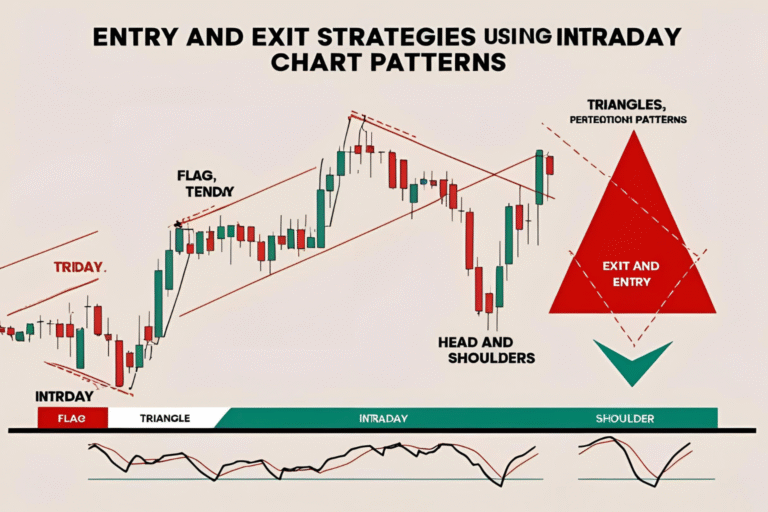
1. Breakout Patterns (e.g., Triangle, Flag, Rectangle)
- Volume should increase on breakout.
- Low volume breakouts often fail or reverse.
2. Reversal Patterns (e.g., Double Top/Bottom, Head & Shoulders)
- Look for volume divergence: declining volume into the pattern, followed by a spike on breakout.
3. Continuation Patterns (e.g., Cup and Handle)
- Volume declines during consolidation (the “handle”), then spikes on breakout.
Real-Time Volume Tips
- Use Volume Moving Average (VMA) to compare current volume vs. average.
- Watch for volume spikes near key levels (support/resistance).
- Avoid setups during low-volume sessions (e.g., midday lull).
Example: Volume Confirmation on a Bull Flag
Chart Pattern: Bull Flag on 5-min chart
Volume Behavior:
- High volume on initial upward move.
- Lower volume during flag formation.
- Surge in volume at breakout confirms trade entry.
Entry Strategy with Volume Confirmation
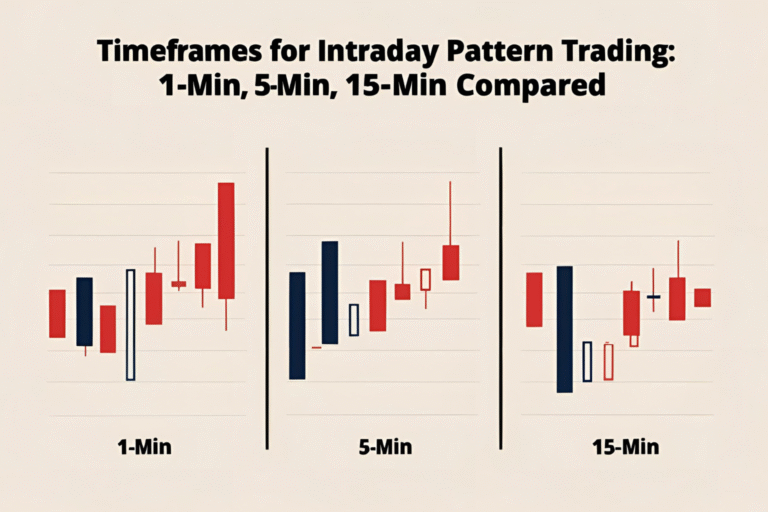
- Identify pattern on 5-min or 15-min chart.
- Wait for price to approach breakout point.
- Confirm volume is rising or spiking on the breakout candle.
- Enter trade with stop-loss below/above the pattern.
- Use volume-supported targets (prior high/low, Fibonacci levels).
Final Thoughts
Volume is the hidden force that validates price action. Chart patterns without volume are like signals without sound. By combining the two, intraday traders can improve the accuracy of their setups and avoid costly fakeouts. Make volume analysis part of your daily trading checklist.
FAQs
Why should I combine chart patterns with volume in intraday trading?
Because volume confirms the strength and reliability of price movements.
What does low volume on a breakout mean?
It often indicates a false breakout or lack of conviction behind the move.
Which indicator helps analyze volume effectively?
The standard volume bar, Volume Moving Average (VMA), and On Balance Volume (OBV) are commonly used.
Do all chart patterns need volume confirmation?
Ideally, yes. Especially for breakouts and reversals, volume is critical.
Can I trade just based on volume spikes?
Volume should support price action, not replace it. Use it as confirmation, not the only entry signal.
