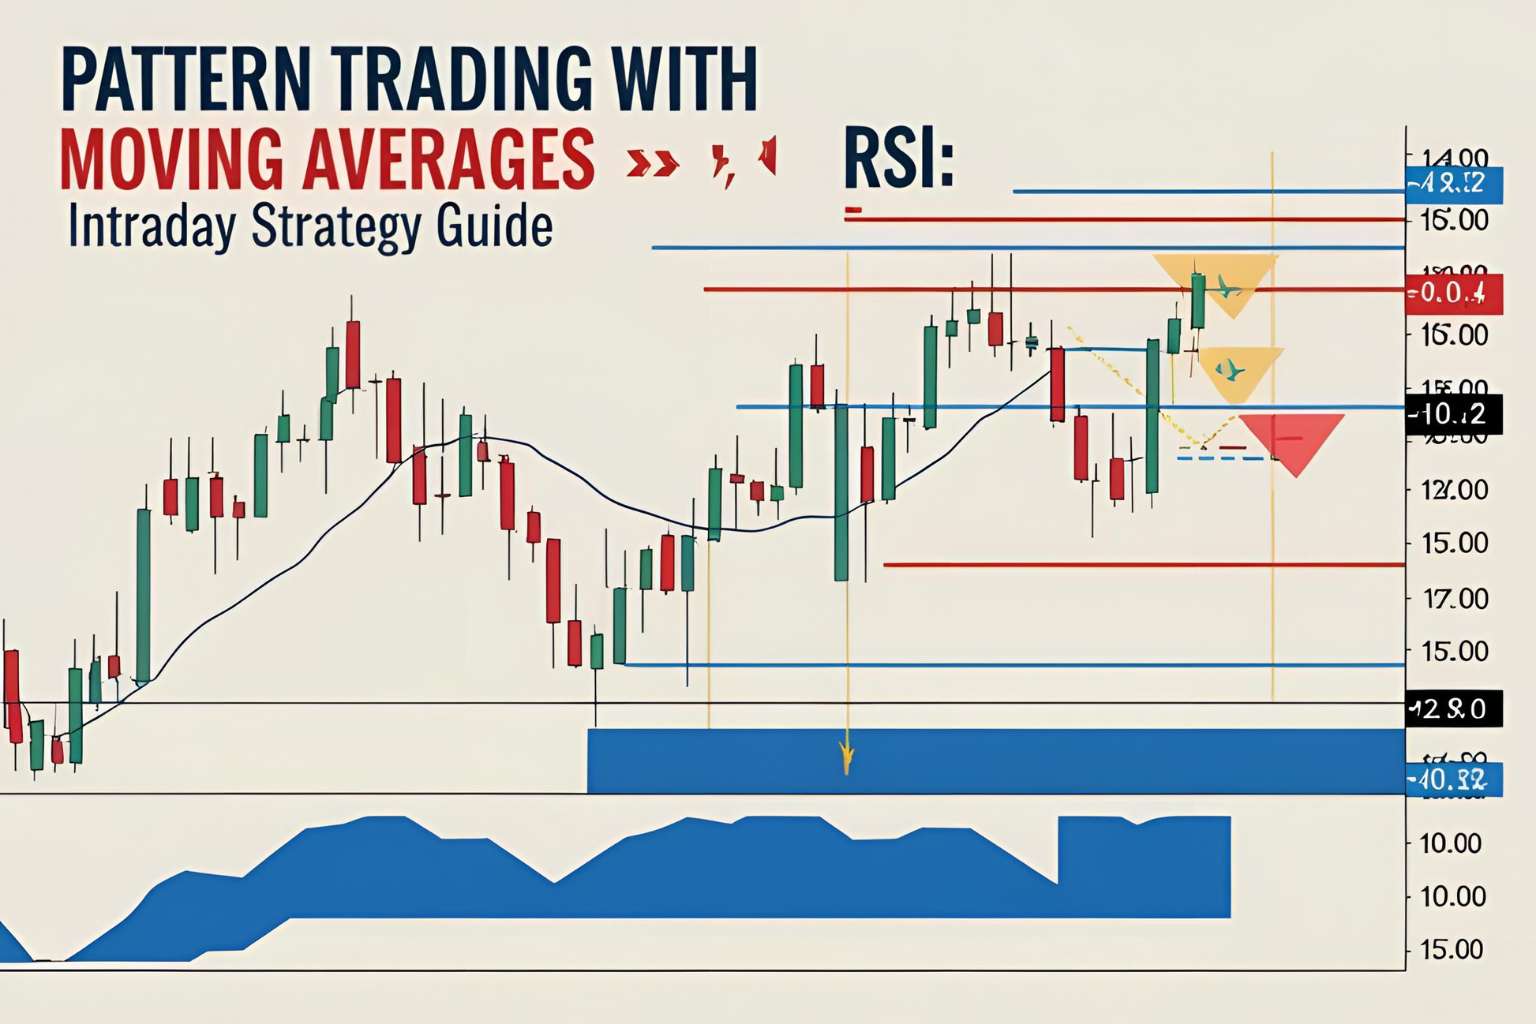
Pattern Trading with Moving Averages and RSI: Intraday Strategy Guide
Chart patterns offer structure. Indicators like Moving Averages (MA) and Relative Strength Index (RSI) add confirmation. When used together, they create a powerful strategy for intraday traders. This guide explains how to integrate moving averages and RSI with chart patterns to improve trade decisions and reduce false signals.
Why Combine Indicators with Patterns?
While chart patterns highlight potential price movements, they lack momentum confirmation. Indicators fill that gap by:
- Confirming trend strength (moving averages)
- Signaling overbought/oversold zones (RSI)
- Filtering out weak or risky setups
How to Use Moving Averages with Patterns
1. Trend Confirmation
- Use 20 EMA (short-term) and 50 EMA (medium-term).
- If price is above both EMAs → bullish trend; below → bearish trend.
2. Support & Resistance
- Patterns like bull flags and ascending triangles are stronger when forming near the 20 EMA in an uptrend.
3. Crossover Signals
- Combine double bottom patterns with 20/50 EMA crossover for added confirmation.
How to Use RSI with Patterns
1. Overbought/Oversold Zones
- RSI above 70 = Overbought → Watch for bearish patterns like double top or evening star.
- RSI below 30 = Oversold → Watch for bullish setups like double bottom or morning star.
2. Divergence
- Price makes higher highs, RSI makes lower highs → Bearish divergence.
- Works well with reversal patterns.
Sample Strategy: Bull Flag + Indicators
- Chart Pattern: Bull flag
- Indicators: 20 EMA (price should bounce near it), RSI between 50–70
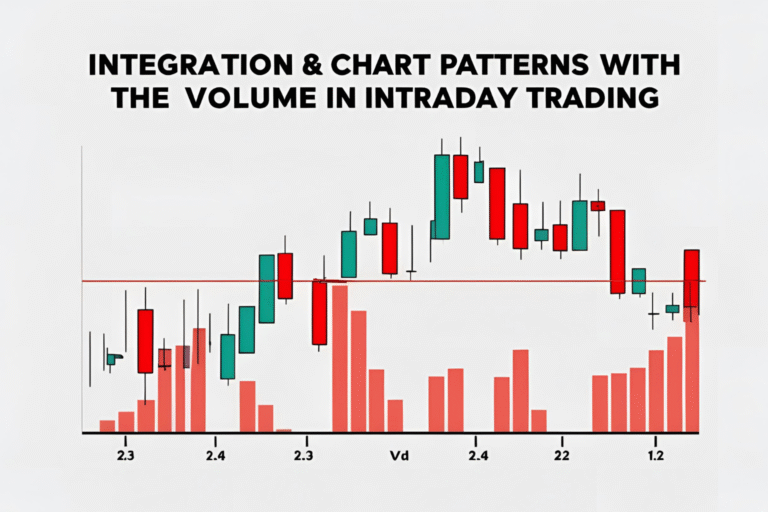
- Confirmation: Breakout from flag with volume
- Entry: Above breakout candle
- Stop-Loss: Below flag support
- Exit: Previous swing high or 1:2 R:R
Tips for Better Accuracy
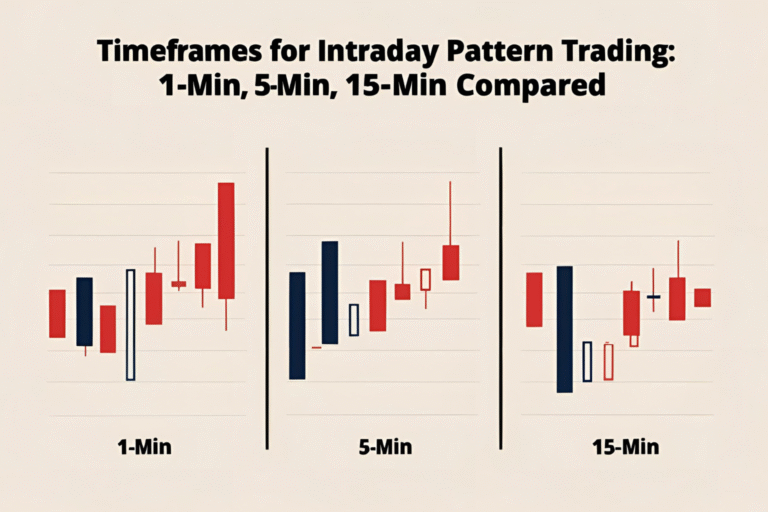
- Use 5-min or 15-min charts for intraday confirmation.
- Avoid taking pattern trades when RSI is flat or near 50 (neutral).
- Let the pattern and indicators agree before entering a trade.
Common Mistakes to Avoid
- Ignoring indicator signals that conflict with the pattern.
- Using too many indicators—stick to 1 or 2 max for intraday.
- Forcing trades when neither the pattern nor indicators confirm each other.
Final Thoughts
Combining chart patterns with moving averages and RSI creates a reliable system for intraday trading. Patterns give structure; indicators add timing and confirmation. Use them together to boost confidence, consistency, and profits.
FAQs
Should I use indicators for every chart pattern trade?
Yes, especially for intraday setups, indicators add an important layer of confirmation.
What’s the best moving average for intraday pattern trading?
The 20 EMA and 50 EMA are commonly used for trend direction and support/resistance.
Can RSI alone confirm a trade?
Not ideally. RSI is more effective when combined with price action or chart patterns.
How do I use RSI divergence with patterns?
Watch for divergence near key reversal zones. Combine with patterns like double tops/bottoms or head and shoulders.
Is this method suitable for beginners?
Yes. It’s a simple and effective strategy once you understand basic candlesticks and indicator behavior.