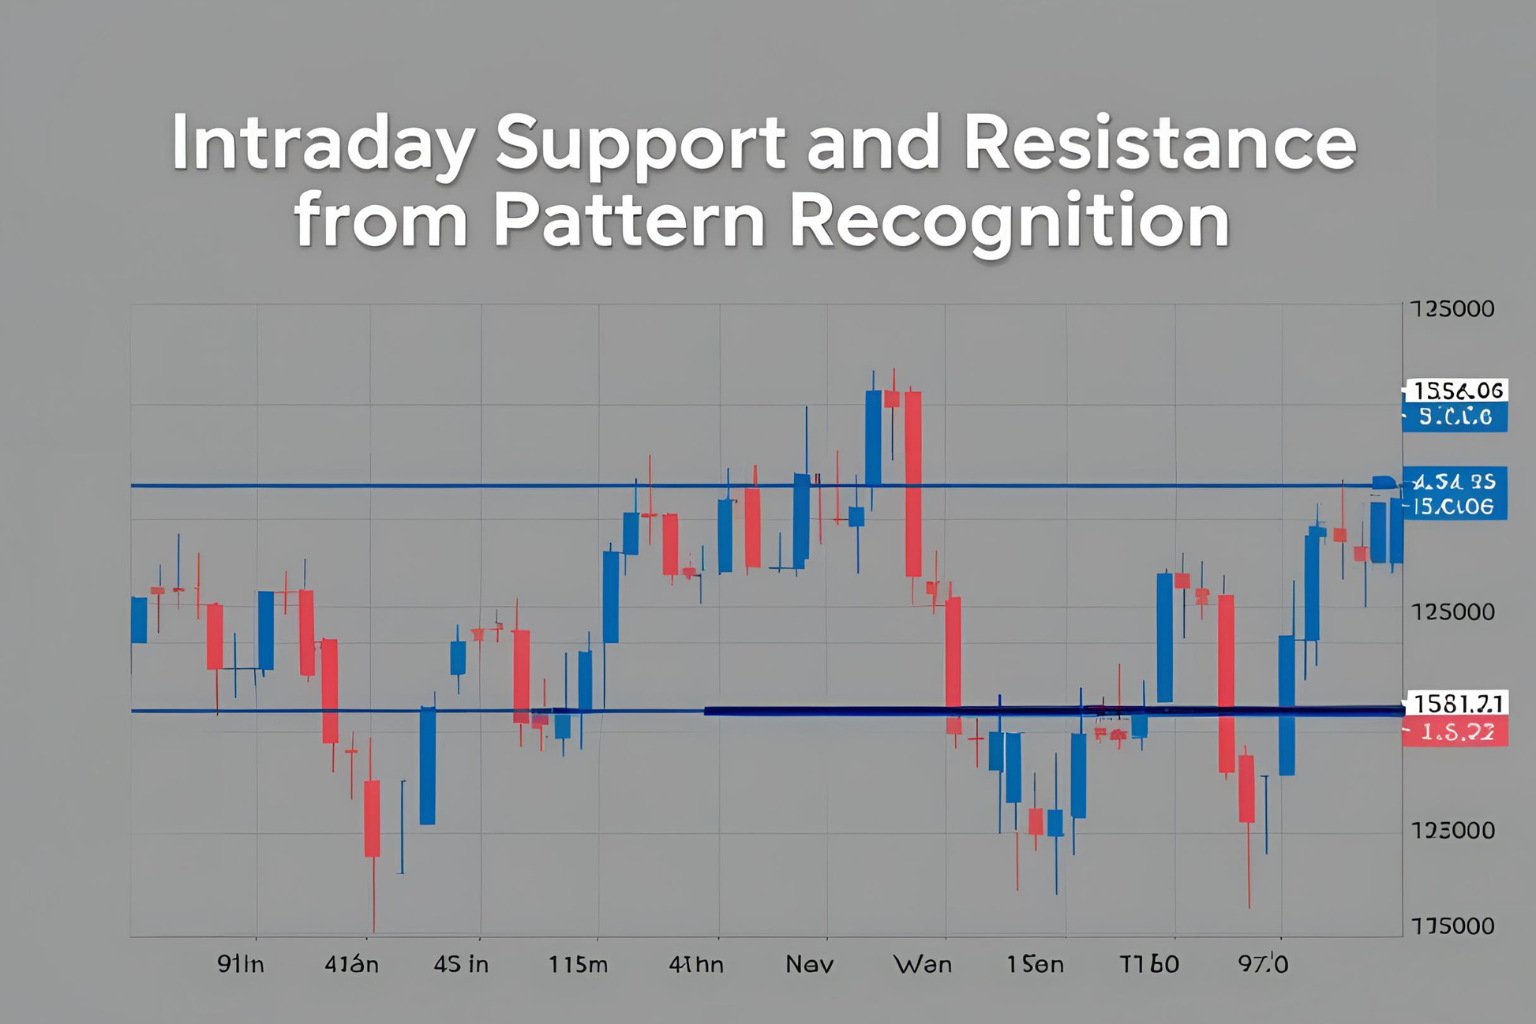
Intraday Support and Resistance from Pattern Recognition
Support and resistance are critical tools for any intraday trader. When combined with chart pattern recognition, these levels become even more powerful. They help define trade entries, exits, and stop-loss levels with precision. This guide explains how to identify support and resistance using pattern-based analysis.
What Are Support and Resistance Levels?
- Support: A price level where demand prevents further decline.
- Resistance: A price level where supply limits further rise.
In intraday trading, these levels often shift quickly and must be recalculated throughout the day.
Why Use Patterns to Identify These Levels?
Chart patterns naturally form around key support and resistance zones. Recognizing these patterns helps:
- Predict turning points
- Validate breakout or reversal trades
- Set more accurate stop-loss and profit targets
Common Patterns That Reveal Support & Resistance
1. Double Top / Double Bottom
- The second top/bottom confirms resistance/support.
- Neckline becomes the key breakout level.
2. Head and Shoulders / Inverse
- The neckline acts as strong support/resistance.
- Pattern failure often leads to sharp reversals.
3. Triangles (Ascending, Descending, Symmetrical)
- Flat lines in triangles often represent strong S/R.
- Breakout direction defines future zones.
4. Flags and Pennants
- Consolidation levels serve as temporary support or resistance.
- Breakouts from these patterns shift those zones quickly.
How to Draw Support and Resistance Using Patterns
- Use recent highs/lows from recognizable patterns.
- Mark necklines, horizontal flat areas, and trendline break points.
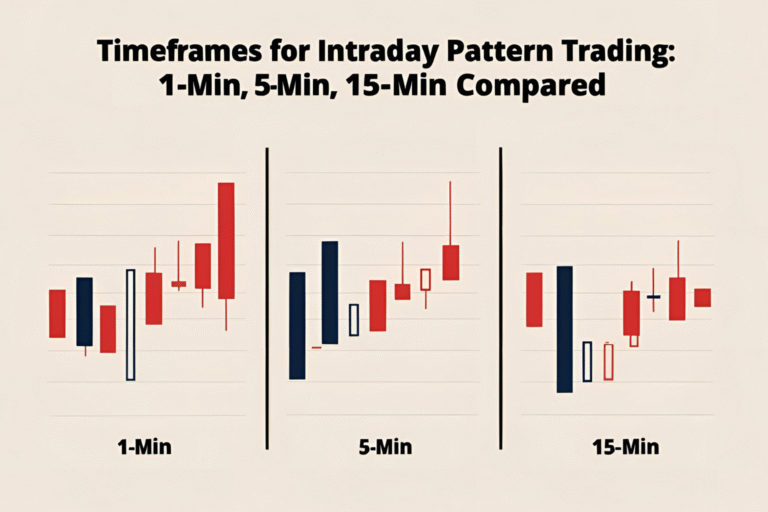
- Draw levels on 5-minute and 15-minute charts for intraday accuracy.
- Confirm zones with volume spikes or price rejection wicks.
Intraday Trading Example
Pattern: Ascending Triangle
- Flat resistance at ₹150, rising support trendline.
- Price breaks out above ₹150 with high volume.
- ₹150 becomes new support; use it for pullback entry.
Pro Tips
- Avoid crowding charts with too many lines.
- Confirm zones with at least 2–3 price reactions.
- Adjust levels dynamically as price action evolves.
- Use VWAP, EMA, or RSI to further confirm strength at these zones.
Final Thoughts
Recognizing support and resistance through chart patterns gives intraday traders an edge. It helps filter noise, confirm trades, and manage risk more effectively. Practice identifying these zones during live market hours to build real-time intuition.
FAQs
How do patterns help identify support and resistance?
Patterns like triangles, double tops/bottoms, and flags form around key price levels, which often act as support or resistance.
Which timeframe is best for intraday S/R levels?
The 5-minute and 15-minute charts are most commonly used for precise intraday S/R analysis.
Should I update support/resistance levels during the day?
Yes. Markets evolve, and S/R zones shift based on new price action.
Can indicators confirm support and resistance?
Yes. Tools like VWAP, RSI, and volume help validate these zones.
Is it better to trade from support/resistance or wait for breakouts?
Both are valid strategies, but confirmation is key in either case.