Pattern Confirmation Using MACD and Stochastic for Intraday Traders
Chart patterns form the foundation of many intraday strategies, but without proper confirmation, they can lead to false breakouts and whipsaws. That’s where indicators like MACD and Stochastic Oscillator come in. This guide explains how to use these tools to confirm pattern-based setups for better trade accuracy.
Why Use Indicators for Pattern Confirmation?
- Eliminates weak setups
- Filters out market noise
- Adds momentum or reversal confirmation
- Supports entry timing and stop placement
What Is MACD?
MACD (Moving Average Convergence Divergence) is a trend-following momentum indicator.
- MACD Line = 12 EMA – 26 EMA
- Signal Line = 9 EMA of MACD Line
- Histogram = Difference between MACD Line and Signal Line
Used for:
- Spotting momentum direction
- Confirming breakouts
- Detecting divergence with price
What Is the Stochastic Oscillator?
Stochastic measures the closing price relative to the high-low range over a period.
- Consists of %K and %D lines
- Ranges between 0 and 100
- Overbought zone: Above 80
- Oversold zone: Below 20
Used for:
- Identifying reversals
- Timing entries/exits
- Spotting overbought/oversold levels
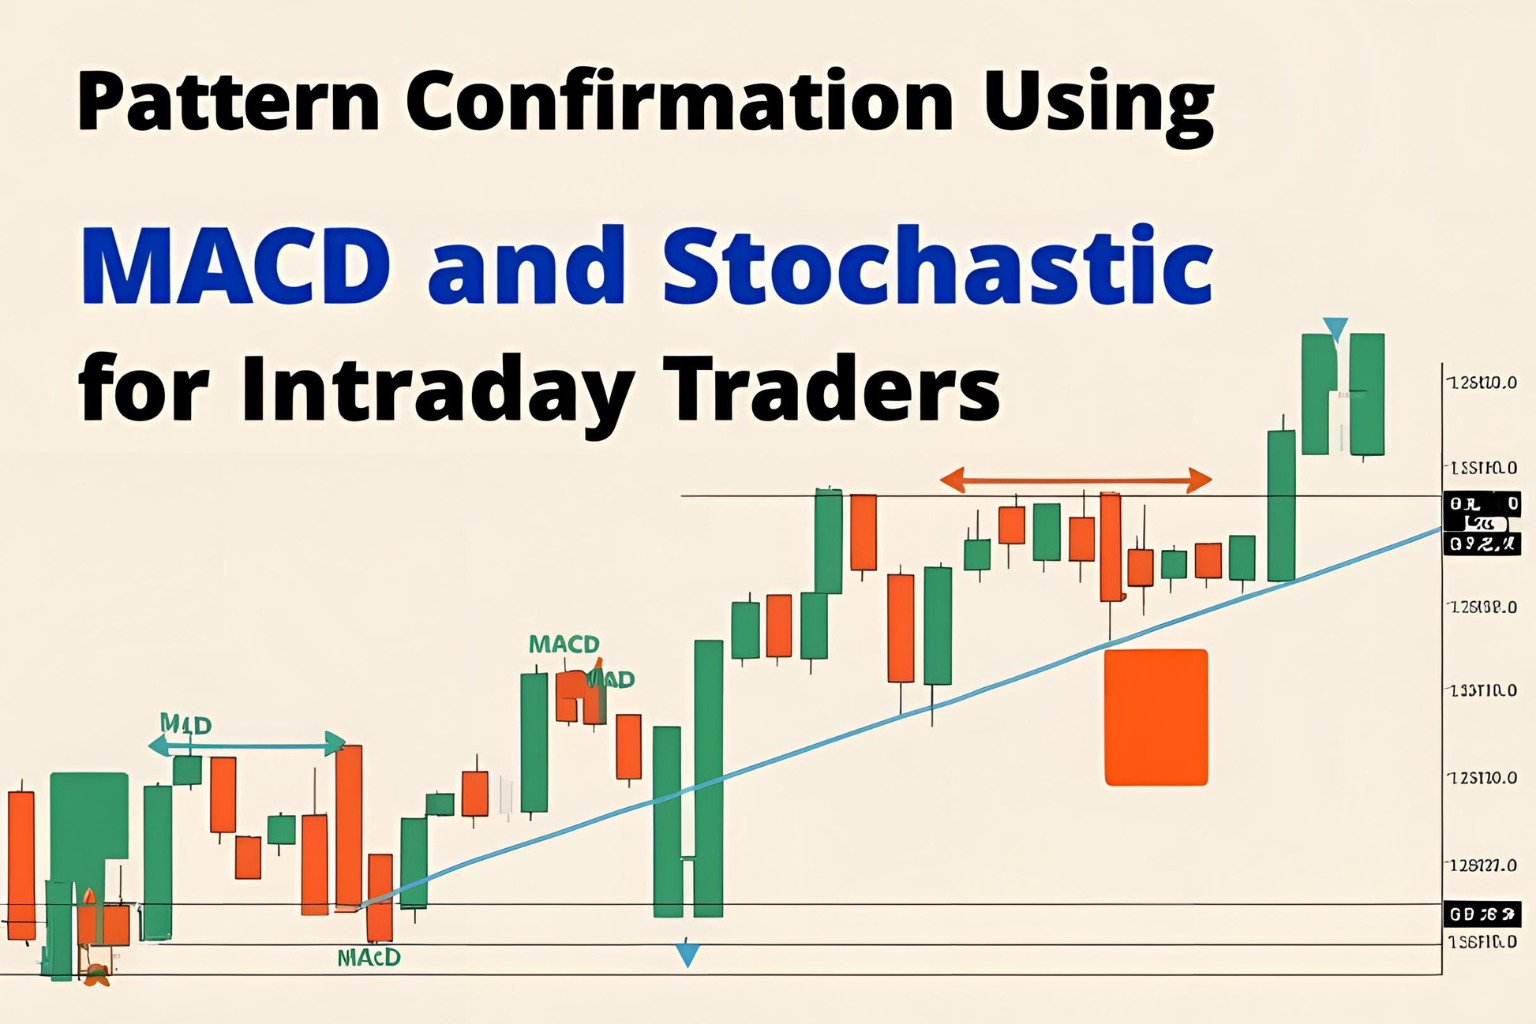
How to Confirm Patterns with MACD
✅ MACD Bullish Confirmation
- Price breaks out of a pattern (e.g., triangle or flag)
- MACD Line crosses above Signal Line
- Histogram turns positive
✅ MACD Bearish Confirmation
- Price breaks below support
- MACD Line crosses below Signal Line
- Histogram turns negative
How to Confirm Patterns with Stochastic
✅ Bullish Setup
- Pattern: Double bottom or Morning Star
- Stochastic rises from below 20
- Entry after crossover of %K above %D
✅ Bearish Setup
- Pattern: Head and Shoulders or Double Top
- Stochastic falls from above 80
- Entry after %K crosses below %D
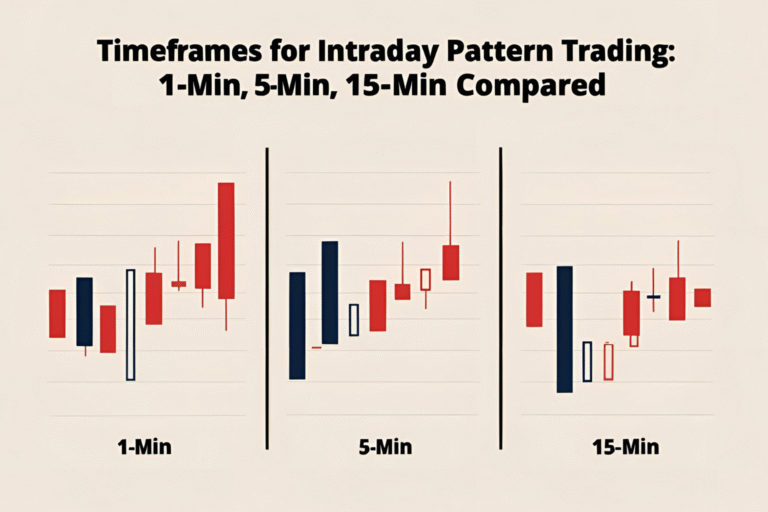
Best Timeframes for Intraday Confirmation
- Use 5-minute or 15-minute charts for both MACD and Stochastic
- Confirm pattern breakouts or reversals on the same timeframe as the setup
Example Strategy: Triangle Breakout + MACD + Stochastic
- Spot ascending triangle on 5-min chart
- Wait for breakout candle above resistance
- MACD crossover confirms bullish momentum
- Stochastic rising from oversold zone
- Enter trade with stop-loss below breakout candle
- Exit at previous high or 1:2 R:R
Final Thoughts
MACD and Stochastic are powerful tools when paired with chart patterns. They add an extra layer of confirmation that helps intraday traders avoid low-quality trades. Practice reading both indicators alongside patterns to improve timing, confidence, and consistency.
FAQs
Can MACD and Stochastic be used together?
Yes. MACD confirms momentum; Stochastic identifies overbought/oversold conditions, making them a great combination.
Which is better for intraday—MACD or Stochastic?
MACD is better for trend confirmation, while Stochastic is better for timing entries near reversals.
Do these indicators lag behind price?
Yes, they are lagging indicators, but when used for confirmation (not signals), they are very effective.
Should I enter a trade without indicator confirmation?
It’s riskier. Confirming your pattern with MACD or Stochastic increases your probability of success.
Are these indicators suitable for all chart patterns?
Yes, especially breakout and reversal patterns like flags, triangles, and double tops/bottoms.