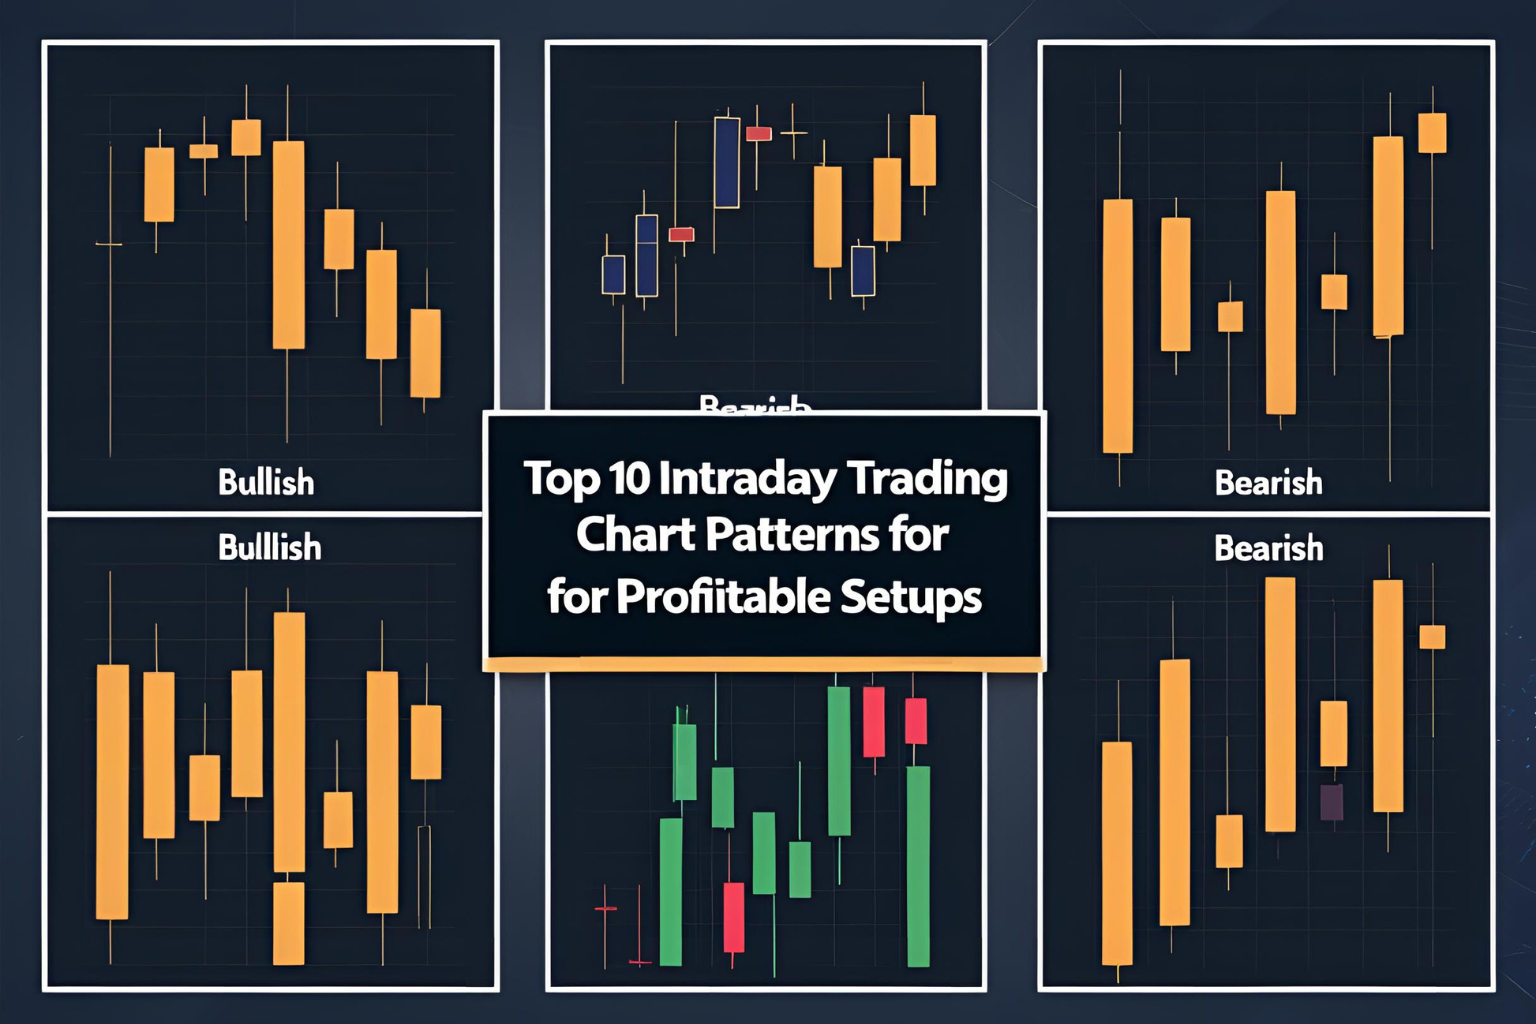
Top 10 Intraday Trading Chart Patterns for Profitable Setups
Intraday trading requires speed, precision, and a clear understanding of market behavior. Chart patterns play a vital role in helping traders recognize price trends, reversals, and breakout opportunities in real-time. In this post, we’ll explore the top 10 intraday trading chart patterns every trader should know and how to use them effectively.
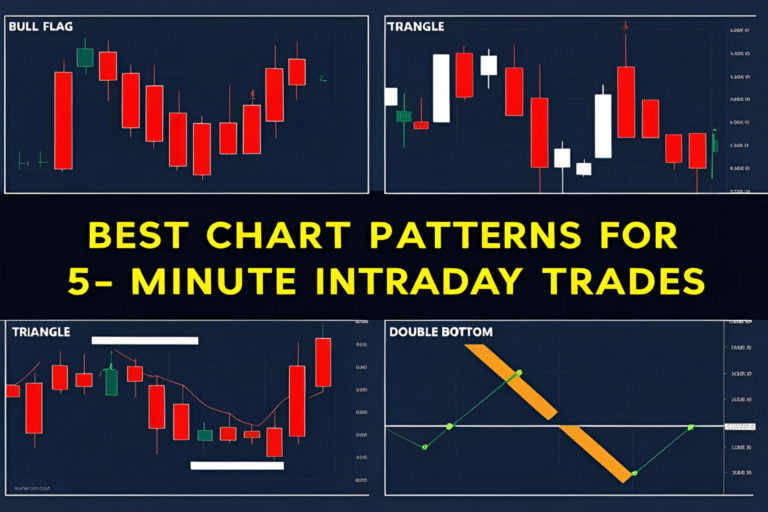
1. Bull Flag Pattern
A continuation pattern that forms after a sharp price rise. The price consolidates in a small downward channel before continuing upward.
Best Use:
Entry during breakout above the flag for bullish momentum.
2. Bear Flag Pattern
Opposite of the bull flag, it forms after a sharp drop. Price moves slightly upward or sideways, then breaks down again.
Best Use:
Sell short after the price breaks below the flag’s support.
3. Ascending Triangle
This bullish pattern features a flat top resistance and rising trendline support.
Best Use:
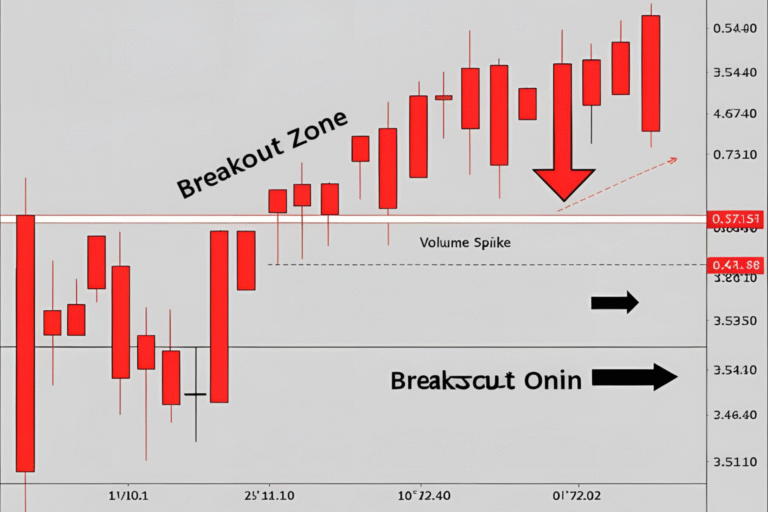
Buy after breakout above the resistance with volume.
4. Descending Triangle
A bearish setup with flat support and descending highs.
Best Use:
Sell short after a confirmed breakdown below the support.
5. Double Top
A reversal pattern signaling a potential downtrend after two peaks.
Best Use:
Sell after neckline break, confirming the pattern.
6. Double Bottom
Signals a bullish reversal after two lows form near the same support.
Best Use:
Buy after breakout above the neckline.
7. Head and Shoulders
One of the strongest reversal patterns, often seen before a major price decline.
Best Use:
Sell after the right shoulder completes and price breaks the neckline.
8. Inverse Head and Shoulders
A bullish reversal pattern, effective after a downtrend.
Best Use:
Buy after breakout above the neckline resistance.
9. Symmetrical Triangle
A neutral pattern where price consolidates with converging trendlines.
Best Use:
Trade breakouts in either direction with strong volume confirmation.
10. Cup and Handle
This pattern resembles a teacup and indicates a continuation after a consolidation phase.
Best Use:
Buy after breakout from the handle’s resistance.
Final Thoughts
Mastering these chart patterns can significantly enhance your intraday trading strategy. The key is recognizing the setup early and confirming it with volume, support/resistance, or additional indicators.
FAQs
What are intraday chart patterns?
They are visual formations on price charts that indicate potential market moves within the same trading day.
Which intraday pattern is most reliable?
The Bull Flag and Double Bottom are among the most reliable for bullish intraday trades.
Do patterns work on all timeframes?
Yes, but for intraday, 1-min, 5-min, and 15-min charts are most commonly used.
Should I use indicators with patterns?
Yes, combining patterns with RSI, MACD, or volume can improve trade accuracy.
Are chart patterns enough for intraday trading?
Patterns are powerful, but risk management, volume, and market context are also crucial for success.