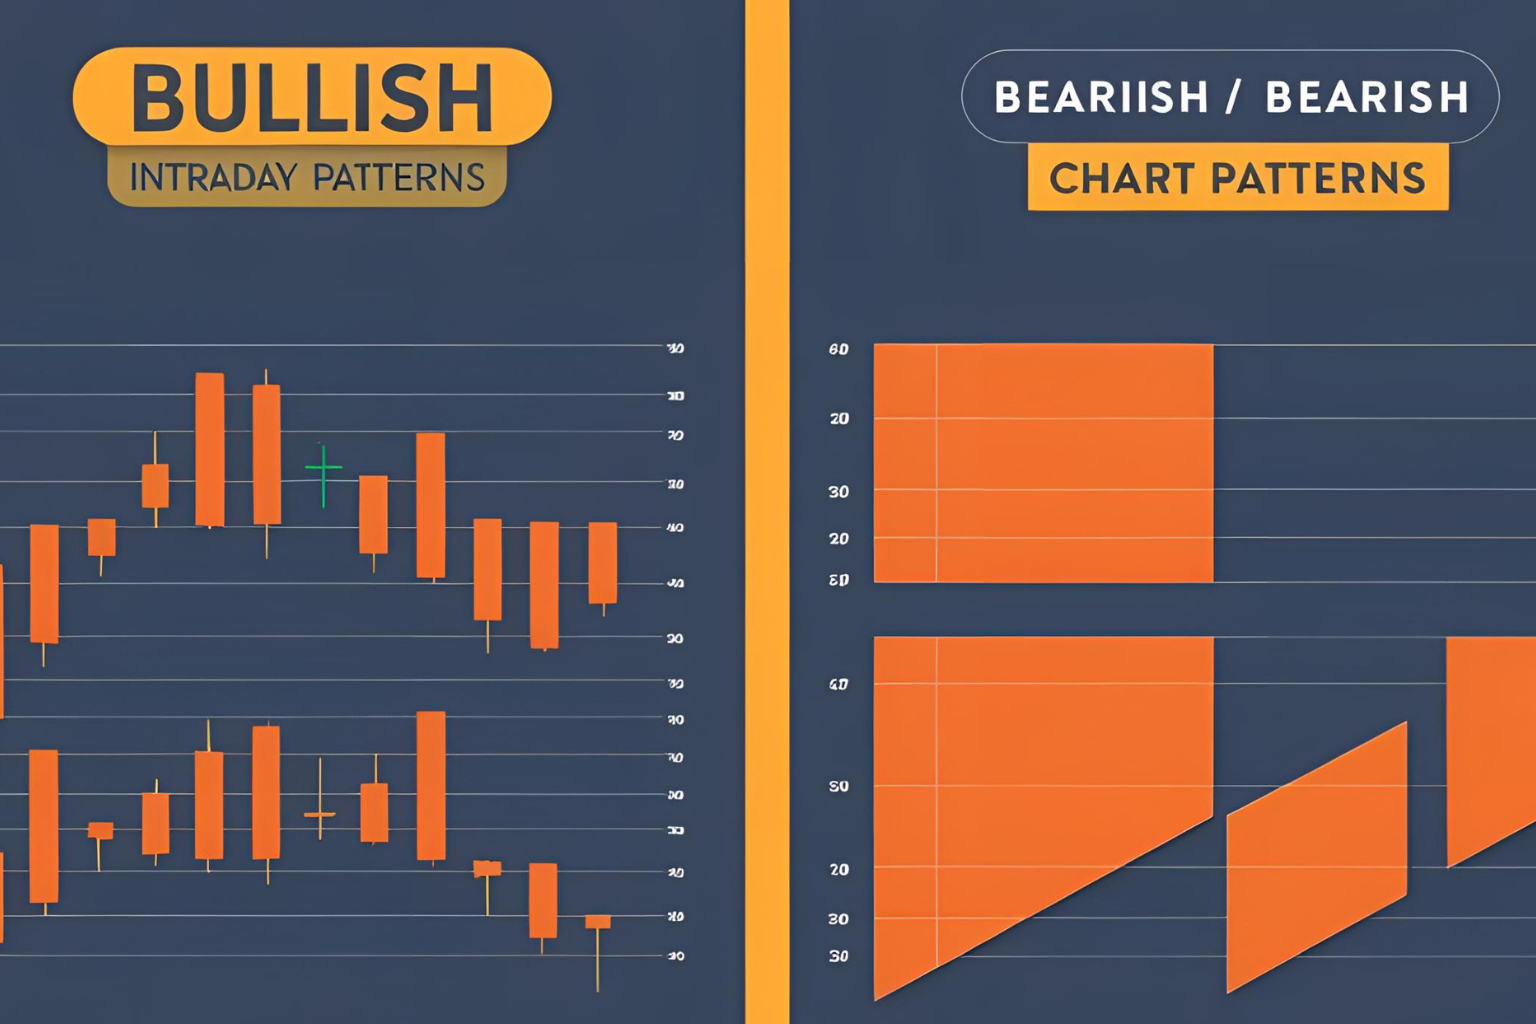
Bullish vs Bearish Intraday Chart Patterns: Key Differences
Intraday trading involves quick decision-making, and knowing whether a pattern signals a bullish or bearish move can make or break your trade. In this guide, we’ll help you differentiate between bullish and bearish intraday chart patterns and explain how to act on them effectively.
What Are Bullish and Bearish Chart Patterns?
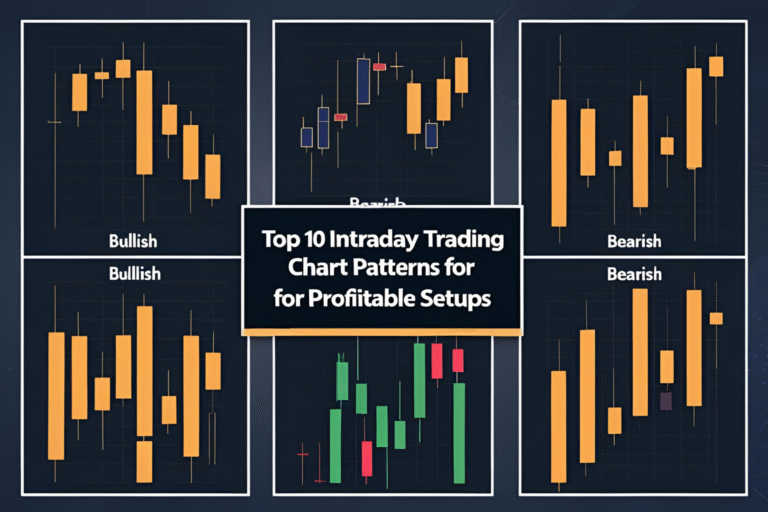
- Bullish patterns suggest that the price is likely to rise.
- Bearish patterns signal that the price may decline.
Both are commonly used in intraday strategies to identify trade entries and exits.
Common Bullish Intraday Chart Patterns
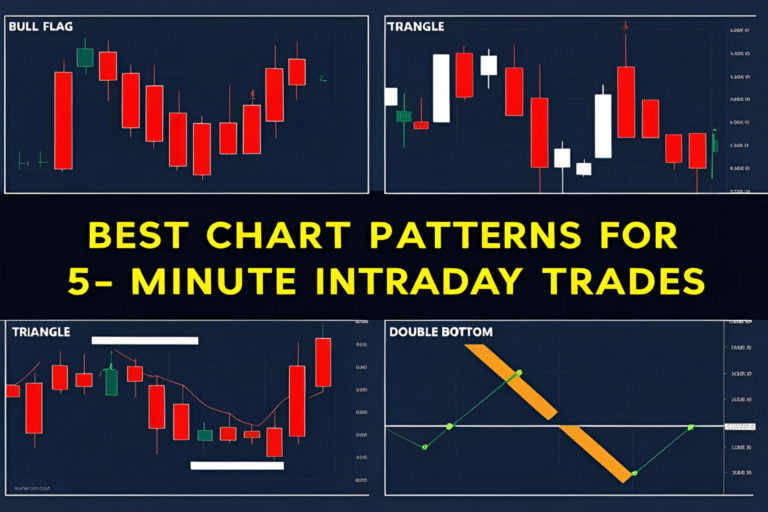
1. Bull Flag
A strong upward move followed by a small downward consolidation. Signals trend continuation.
2. Double Bottom
Two equal lows with a breakout above the neckline. Indicates reversal to the upside.
3. Inverse Head and Shoulders
Three valleys with the middle one lower. Breakout above the neckline is bullish.
4. Ascending Triangle
Flat resistance with rising lows. Breakout above resistance confirms bullish momentum.
5. Cup and Handle
A U-shaped curve followed by a small dip (handle) before breaking out.
Common Bearish Intraday Chart Patterns
1. Bear Flag
A steep drop followed by a small upward consolidation. Breakout signals continuation downward.
2. Double Top
Two peaks with a neckline. Break below the neckline confirms bearish reversal.
3. Head and Shoulders
A central high flanked by two smaller highs. Signals reversal when the neckline is broken.
4. Descending Triangle
Flat support with lower highs. Breakdown below support confirms bearish move.
5. Rising Wedge
Price rises within converging lines. Breakout downward is a bearish signal.
Key Differences Between Bullish and Bearish Patterns
| Aspect | Bullish Patterns | Bearish Patterns |
|---|---|---|
| Price Direction | Indicates upward movement | Indicates downward movement |
| Trend Bias | Favors long entries | Favors short entries |
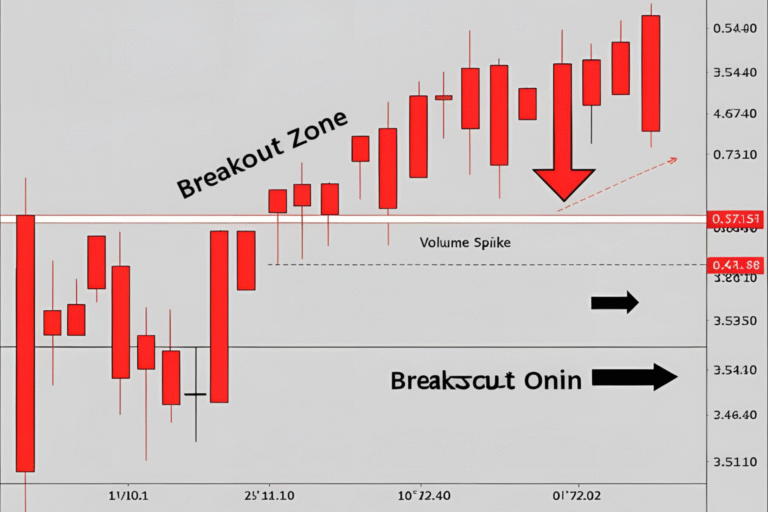
| Volume Confirmation | Breakouts show rising volume | Breakdowns show rising volume |
| Setup Formation | Often at support or after a pullback | Often at resistance or after a rally |
Trading Tips
- Always confirm the pattern with volume or indicators like RSI/MACD.
- Set stop-loss just below support (bullish) or above resistance (bearish).
- Use real-time pattern scanners to catch setups early.
Final Thoughts
Recognizing whether a chart pattern is bullish or bearish is essential for fast-paced intraday decisions. Study the structure, wait for confirmation, and always manage risk. With practice, you’ll spot high-probability patterns in seconds.
FAQs
What’s the main difference between bullish and bearish patterns?
Bullish patterns predict upward moves; bearish patterns suggest declines.
Can a pattern switch from bullish to bearish?
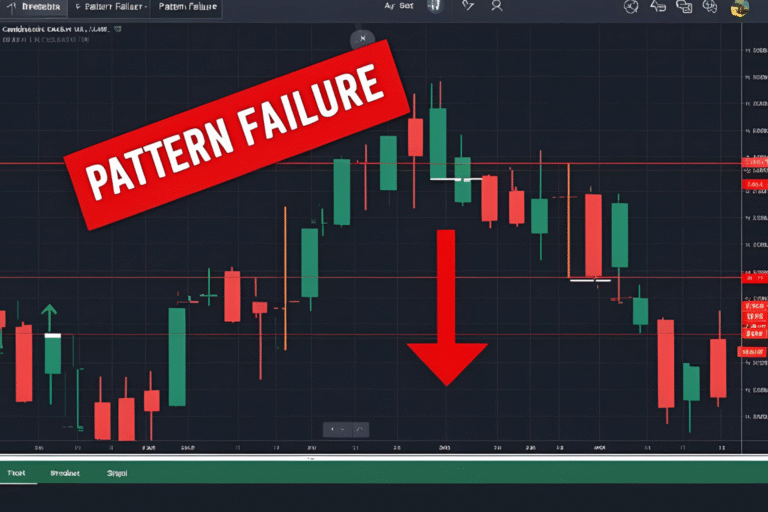
Yes, false breakouts or failed patterns can reverse quickly, so confirmation is key.
Do bullish patterns work in all markets?
Yes, they work in stocks, forex, and crypto—especially in intraday timeframes.
Which is more reliable—bullish or bearish patterns?
Both can be reliable with proper confirmation and volume analysis.
How do I practice identifying patterns?
Use replay mode on TradingView or review historical intraday charts for hands-on learning.
