How to Identify Breakout Patterns in Intraday Charts
Breakout trading is a popular and powerful approach in intraday markets. It helps traders capitalize on sharp moves that occur when price breaks through support or resistance levels. But not all breakouts are reliable. This post will teach you how to identify strong breakout patterns, confirm their validity, and execute trades with confidence.
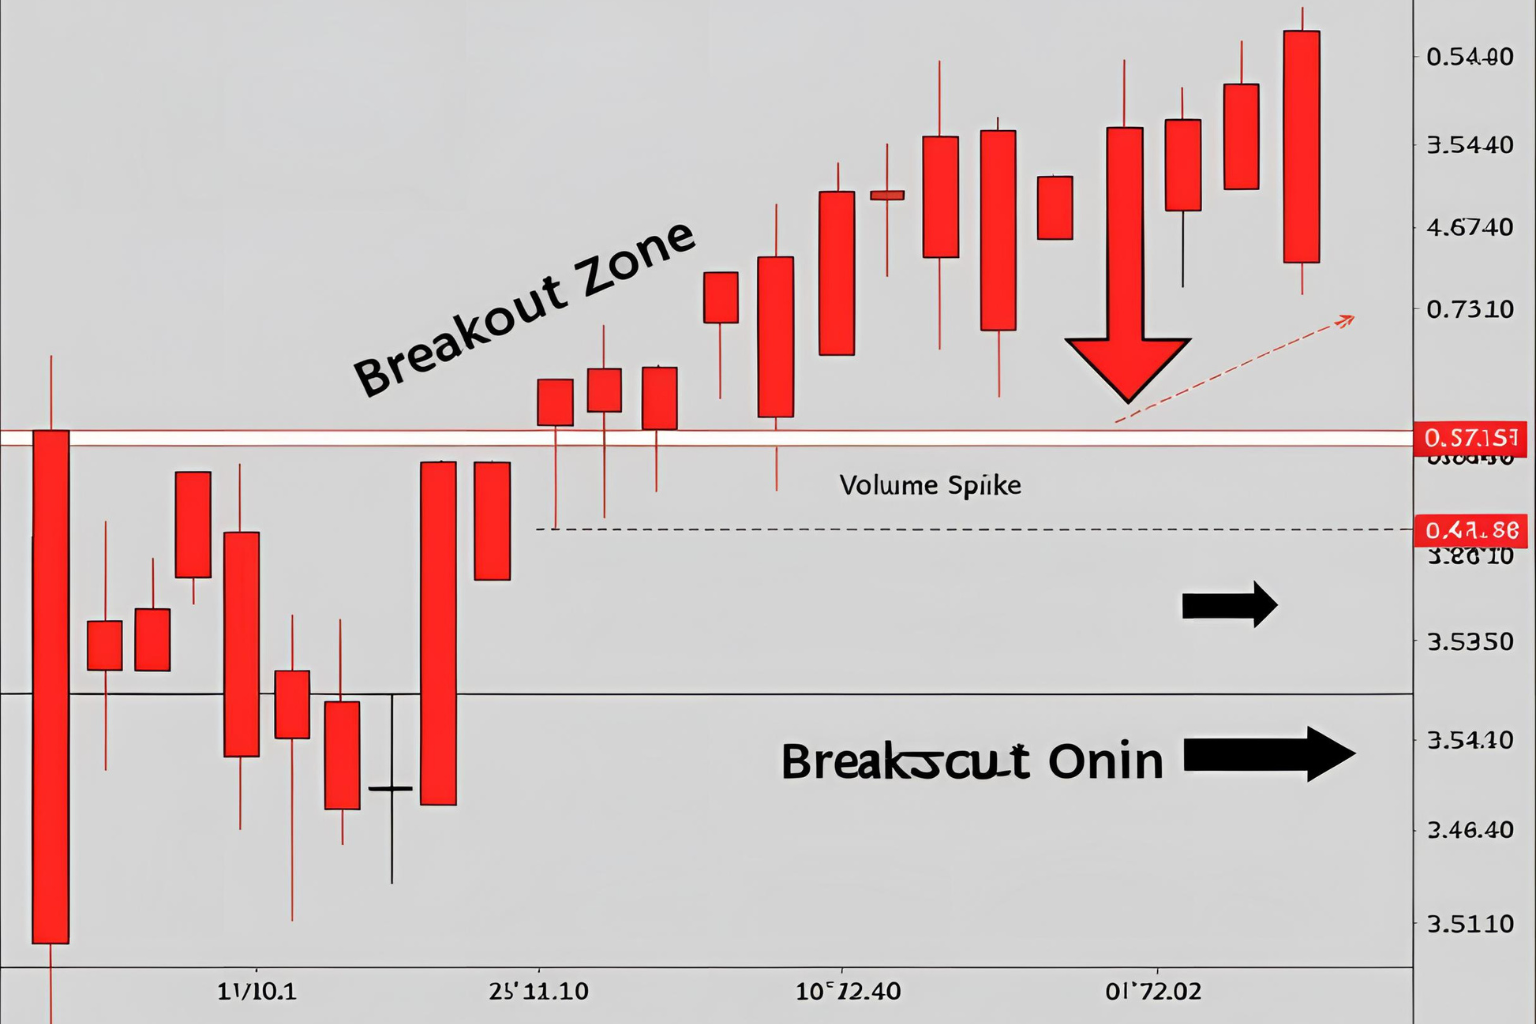
What Is a Breakout Pattern?
A breakout occurs when the price moves beyond a defined support or resistance level with increased volume. Breakout patterns typically lead to significant momentum moves, making them attractive for intraday traders.
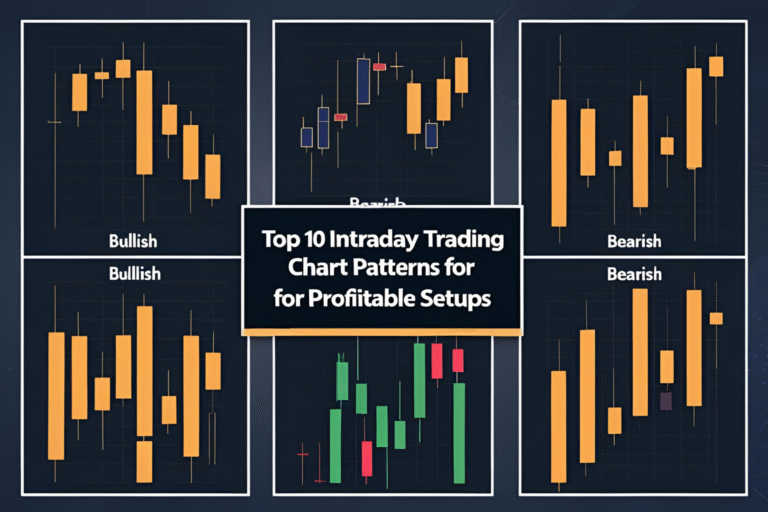
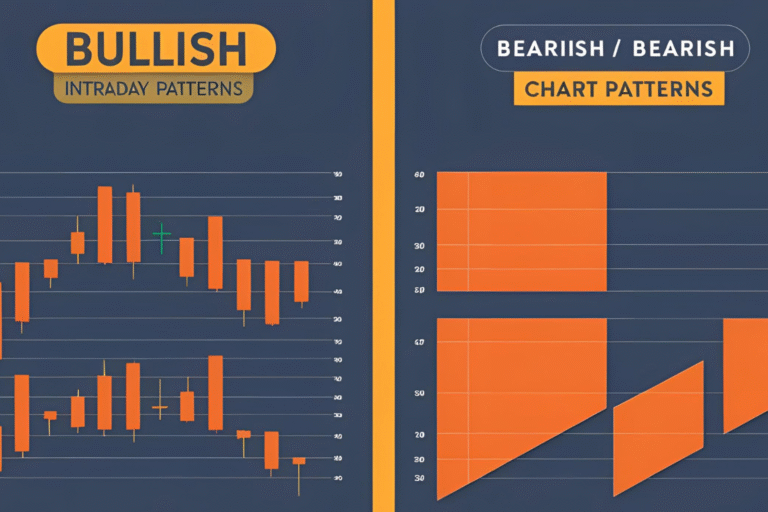
Key Breakout Patterns to Watch
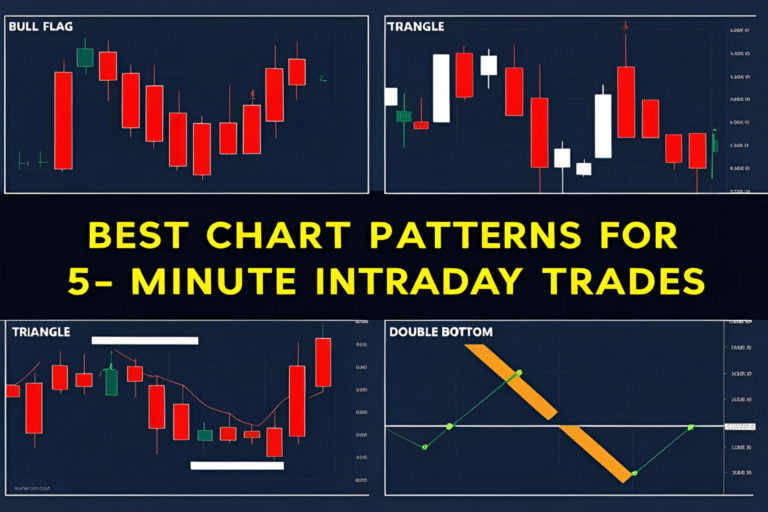
1. Flat Top Breakout (Ascending Triangle)
Characterized by a horizontal resistance and rising support. Price gets squeezed until it breaks out.
Tip: Confirm with rising volume before entry.
2. Flag Breakout
Formed after a sharp move, followed by a tight consolidation. Breakout usually continues in the direction of the trend.
Tip: Look for flag shape on 5-min or 15-min charts.
3. Range Breakout
Happens when price consolidates sideways for a long time and then breaks the upper or lower boundary.
Tip: The longer the range, the stronger the breakout.
4. Cup and Handle Breakout
The cup shape forms after a rounded bottom, followed by a short dip (the handle) and then breakout.
Tip: Confirm with breakout above the handle’s resistance.
5. Breakout from Channel
When price moves outside a rising or falling channel, indicating trend acceleration.
Tip: Confirm with trendline break and volume surge.
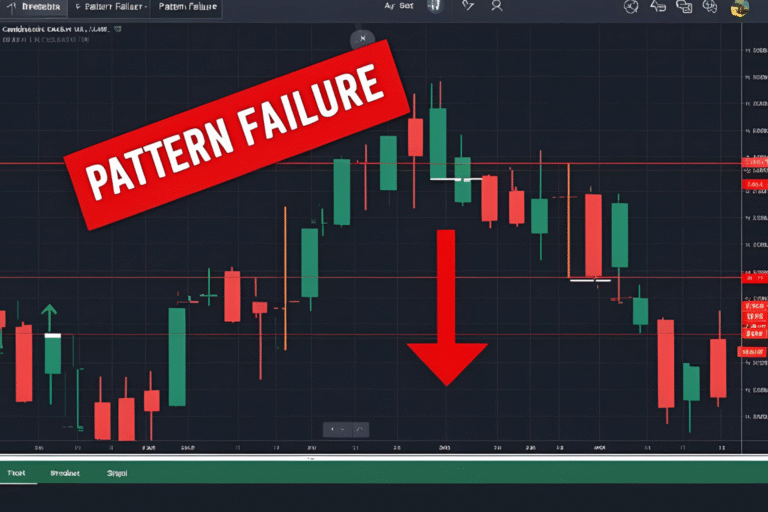
How to Confirm a Valid Breakout
- Volume Surge: Volume must increase at the breakout point.
- Retest: Breakout followed by a retest of the breakout level is often more reliable.
- Candle Confirmation: Strong bullish/bearish candle at breakout.
- Avoid Fakeouts: Don’t enter until the candle closes above/below the level.
Entry and Exit Tips for Breakout Traders
- Entry: Enter after candle close outside the range or on a confirmed retest.
- Stop Loss: Place just below support or above resistance.
- Targets: Use Fibonacci extension, previous swing levels, or risk-reward ratio (1:2 or better).
Final Thoughts
Breakout patterns are powerful tools for intraday traders, especially when confirmed with volume and price action. Develop patience to wait for proper confirmation and avoid chasing false breakouts.
FAQs
What is a breakout in intraday trading?
A breakout is when the price moves beyond a defined support or resistance level, often triggering momentum.
Which chart timeframe is best for breakout patterns?
The 5-minute and 15-minute charts are commonly used for intraday breakout setups.
How do I avoid false breakouts?
Use volume confirmation, wait for candle close, and avoid trading during low liquidity periods.
Are breakouts profitable for intraday trades?
Yes, especially when paired with proper risk management and confirmation techniques.
Should I enter breakouts early or wait?
Always wait for confirmation—either a breakout candle close or a successful retest.